

Kentucky offers one of the most affordable lifestyles in the United States, with a cost of living approximately 8% below the national average. But what salary do you actually need to live comfortably in the Bluegrass State? According to SmartAsset’s 2025 study, a single adult in Kentucky needs approximately $83,574 annually to live comfortably, making it the fifth-most affordable state in the nation. This comprehensive guide breaks down exactly how much you need to earn across different household sizes, cities, and lifestyles.
How Much Salary Do You Need to Live Comfortably in Kentucky?
Using the widely-accepted 50/30/20 budgeting rule—allocating 50% to necessities, 30% to discretionary spending, and 20% to savings and debt repayment—the salary needed to live comfortably in Kentucky varies significantly based on household composition. The 50/30/20 framework ensures you can afford not just basic necessities, but also hobbies, vacations, retirement savings, education funds, and occasional emergencies.
| Household Type | Annual Salary Needed (2026) | Monthly Income | National Rank |
|---|---|---|---|
| Single Adult, No Children | $83,574 | $6,965 | 5th Most Affordable |
| Family of Four (Two Earners) | $192,941 | $16,078 | 2nd Most Affordable |
| Single Adult, One Child | $138,916 | $11,576 | Top 10 |
| Single Adult, Two Children | $170,960 | $14,247 | Top 10 |
| Two Adults (One Working), No Children | $117,864 | $9,822 | Top 10 |
| Two Adults (Both Working), Two Children | $192,934 | $16,078 combined | 2nd Most Affordable |
While these figures represent comfortable living with savings capacity, the reality for many Kentuckians looks quite different. According to Income by Zipcode data, the median income for a single person in Kentucky was only $31,871 in 2024, while the average was $34,960—representing an 82-86% gap between actual earnings and the comfortable living threshold.

What Is the Living Wage in Kentucky?
The living wage represents the minimum hourly rate needed to cover basic necessities without falling into poverty. According to the MIT Living Wage Calculator, a single adult in Kentucky needs to earn at least $20.09 per hour (or $41,787 annually) just to meet basic needs—not to live comfortably, but simply to survive without government assistance.
| Household Composition | Living Wage (Hourly) | Living Wage (Annual) | Poverty Wage (Hourly) | Minimum Wage |
|---|---|---|---|---|
| 1 Adult, 0 Children | $20.09 | $41,787 | $7.52 | $7.25 |
| 1 Adult, 1 Child | $33.39 | $69,451 | $10.17 | $7.25 |
| 1 Adult, 2 Children | $41.10 | $85,488 | $12.81 | $7.25 |
| 1 Adult, 3 Children | $51.78 | $107,702 | $15.46 | $7.25 |
| 2 Adults (1 Working), 0 Children | $28.33 | $58,926 | $10.17 | $7.25 |
| 2 Adults (1 Working), 2 Children | $37.43 | $77,854 | $15.46 | $7.25 |
| 2 Adults (Both Working), 0 Children | $14.17 each | $58,947 combined | $5.08 each | $7.25 |
| 2 Adults (Both Working), 2 Children | $23.19 each | $96,470 combined | $7.73 each | $7.25 |
Kentucky’s minimum wage remains at the federal level of $7.25 per hour, which falls significantly short of even the poverty wage for most household types. A single adult working full-time at minimum wage earns just $15,080 annually—less than half of what’s needed to meet basic expenses.
What Are the Major Living Expenses in Kentucky?
Understanding where your money goes is essential for budgeting. According to the MIT Living Wage Calculator and Salary.com, here’s how typical annual expenses break down for different household sizes in Kentucky:
| Expense Category | Single Adult | Single + 1 Child | Single + 2 Children | 2 Adults + 2 Children |
|---|---|---|---|---|
| Housing | $9,659 | $13,215 | $13,215 | $13,215 |
| Food | $3,846 | $5,656 | $8,473 | $11,274 |
| Transportation | $10,480 | $12,128 | $15,277 | $17,579 |
| Medical/Healthcare | $3,084 | $7,663 | $7,736 | $8,896 |
| Child Care | $0 | $8,018 | $16,036 | $16,036 |
| Internet & Mobile | $1,531 | $1,531 | $1,531 | $2,113 |
| Civic (Taxes, Fees) | $2,589 | $4,557 | $5,031 | $6,450 |
| Other Necessities | $3,770 | $7,242 | $7,587 | $9,120 |
| Annual Taxes | $6,837 | $9,449 | $10,596 | $11,784 |
| Total Required (Before Taxes) | $41,795 | $69,458 | $85,480 | $96,467 |
How Much Does Housing Cost in Kentucky?
Housing represents the largest expense for most Kentucky households, though costs remain significantly below national averages. According to Redfin, the median home price in Kentucky is $281,500 as of October 2025, up 6.8% year-over-year. This compares favorably to the national median of approximately $446,000.
For renters, the average rent in Kentucky is approximately $1,071 per month, versus the national average of $1,639—a savings of nearly $7,000 annually. Rent prices vary significantly by city and apartment size:
| Apartment Size | Kentucky Average | National Average | Savings |
|---|---|---|---|
| Studio | $826 | $1,200 | $374/month |
| 1 Bedroom | $882 | $1,350 | $468/month |
| 2 Bedroom | $1,099 | $1,650 | $551/month |
| 3 Bedroom | $1,440 | $2,100 | $660/month |
| 4 Bedroom | $1,666 | $2,400 | $734/month |
For homebuyers, current mortgage rates in Kentucky hover around 6.06% for a 30-year fixed mortgage and 5.44% for a 15-year fixed mortgage. The Kentucky Housing Corporation offers several assistance programs, including down payment assistance up to $10,000 for eligible buyers.
Housing Costs by Kentucky City
| City | Median Home Price | Average 1BR Rent | Average 2BR Rent |
|---|---|---|---|
| Louisville | $250,000 | $1,233 | $1,442 |
| Lexington | $381,590 | $1,050 | $1,250 |
| Bowling Green | $285,000 | $950 | $1,150 |
| Covington | $208,250 | $1,584 | $2,045 |
| Paducah | $161,000 | $775 | $975 |
| Owensboro | $195,000 | $850 | $1,050 |
| Frankfort | $215,000 | $900 | $1,100 |
| Richmond | $250,000 | $900 | $1,100 |
What Are Monthly Utility Costs in Kentucky?
Utility expenses in Kentucky remain relatively affordable, though they fluctuate seasonally due to the state’s hot summers and cold winters. According to RealEstates Network, the average total utility bill for a single-family home is approximately $536.79 per month in 2025.
| Utility Type | Kentucky Average (Monthly) | National Average | Difference |
|---|---|---|---|
| Electricity | $133.90 | $137.00 | -2% |
| Natural Gas | $129.91 | $135.00 | -4% |
| Water & Sewer | $69.00 | $75.00 | -8% |
| Garbage/Trash | $23.00 | $28.00 | -18% |
| Internet & Cable | $112.66 | $125.00 | -10% |
| Phone (Mobile) | $68.32 | $70.00 | -2% |
| Total Utilities | $536.79 | $570.00 | -6% |
According to EnergySage, Kentucky residents spend an average of $189 per month on electricity alone, using approximately 1,512 kWh monthly. The average electric rate in Kentucky is 12¢ per kilowatt-hour, which is below the national average.
How Much Do Groceries and Food Cost in Kentucky?
Food expenses in Kentucky run approximately 5-11% below the national average, depending on the source. According to ConsumerAffairs, the average weekly grocery bill in Kentucky is $254.57, compared to the U.S. average of $270.21. Monthly food costs average around $352 per person.

| Food Category | Kentucky Cost | National Average | Difference |
|---|---|---|---|
| Monthly Groceries (Single) | $352 | $418 | -16% |
| Weekly Groceries | $254.57 | $270.21 | -6% |
| Annual Food (Single) | $3,846 | $4,500 | -15% |
| Annual Food (Family of 4) | $11,274 | $13,200 | -15% |
| Gallon of Milk | $2.24 | $4.68 | -52% |
| Dozen Eggs | $1.81 | $3.47 | -48% |
| Restaurant Meal (Average) | $15.00 | $18.00 | -17% |
What Are Transportation Costs in Kentucky?
Transportation represents a significant expense for most Kentuckians, particularly since public transit options are limited outside Louisville and Lexington. According to ConsumerAffairs, the average gas price in Kentucky is $2.89 per gallon, compared to the national average of $3.13.
| Transportation Expense | Kentucky Average | National Average | Difference |
|---|---|---|---|
| Gas (per gallon) | $2.89 | $3.13 | -8% |
| Annual Auto Insurance | $1,078 | $1,258 | -14% |
| Annual Transportation (Single) | $10,480 | $12,000 | -13% |
| Annual Transportation (Family) | $17,579 | $20,000 | -12% |
| Vehicle Registration | $21 | $50 | -58% |
| Tire Balancing | $65.88 | $75.00 | -12% |
Annual transportation costs in Kentucky range from $5,477 to $15,530 depending on your commute distance, vehicle type, and whether you rely on personal transportation or public transit. The average Kentuckian commutes about 24 minutes each way to work.
How Much Does Healthcare Cost in Kentucky?
Healthcare costs in Kentucky are approximately 5% below the national average, though they vary significantly based on insurance coverage, age, and health status. According to the MIT Living Wage Calculator, annual healthcare expenses range from $3,084 for a single adult to over $8,896 for a family of four.
| Healthcare Expense | Kentucky Average | National Average |
|---|---|---|
| Annual Healthcare (Single) | $3,084 | $3,500 |
| Annual Healthcare (Family) | $8,896 | $10,000 |
| Employee Health Insurance (Annual) | $1,606 | $1,800 |
| Family Health Insurance Premium | $23,938 | $25,500 |
| Doctor Visit (Avg) | $115 | $125 |
| Dental Cleaning | $95 | $105 |
Kentucky ranks 30th out of 50 states for overall healthcare access and affordability. The state offers health insurance options through the Kentucky Health Benefit Exchange for those without employer coverage.
What Are Childcare Costs in Kentucky?
Childcare represents one of the largest expenses for Kentucky families with young children. According to the MIT Living Wage Calculator, annual childcare costs average $8,018 per child, which translates to approximately $668 to $1,189 per child per month depending on the type of care and age of the child.
| Childcare Type | Monthly Cost (per child) | Annual Cost (per child) |
|---|---|---|
| Infant Care (Center-based) | $900 – $1,189 | $10,800 – $14,268 |
| Toddler Care (Center-based) | $750 – $1,000 | $9,000 – $12,000 |
| Preschool (3-4 years) | $650 – $850 | $7,800 – $10,200 |
| Home-based Care | $550 – $750 | $6,600 – $9,000 |
| After-school Care | $300 – $500 | $3,600 – $6,000 |
Kentucky’s Child Care Assistance Program helps eligible families pay for childcare, making quality care more accessible for low-income households.
What Are Taxes Like in Kentucky?
Kentucky offers a relatively moderate tax burden compared to many states. The state uses a flat income tax rate of 4%, meaning all residents pay the same rate regardless of income level. However, some local cities and counties can levy additional income taxes.
| Tax Type | Kentucky Rate | Notes |
|---|---|---|
| State Income Tax | 4% (flat) | All income levels same rate |
| Sales Tax | 6% | No local additions allowed |
| Property Tax (Effective Rate) | 0.73% – 0.83% | Below national avg of 1.1% |
| Gas Tax | $0.286/gallon | State excise tax |
| Cigarette Tax | $1.10/pack | State excise tax |
For retirees, Kentucky is moderately tax-friendly. Social Security income is exempt from state taxation, and up to $31,110 per person in pension, 401(k), or IRA income is exempt. Amounts above this threshold are taxed at the standard 4% rate.
How Does Cost of Living Vary Across Kentucky Cities?
Cost of living varies significantly depending on where you live in Kentucky. According to RentCafe, cities like Madisonville have higher costs while Covington offers the most affordable urban living at 13% below the national average.
| City | Cost of Living Index | vs. State Average | vs. National Average |
|---|---|---|---|
| Madisonville | 100 | +9% | 0% |
| Louisville | 93 | +2% | -7% |
| Lexington | 92 | +1% | -8% |
| Bowling Green | 88 | -3% | -12% |
| Frankfort | 87 | -4% | -13% |
| Hopkinsville | 85 | -6% | -15% |
| Covington | 87 | -5% | -13% |
| Paducah | 84 | -7% | -16% |
What Is the Average Salary in Kentucky?
Understanding how salaries compare to cost of living is crucial for financial planning. According to ZipRecruiter, the average salary in Kentucky is approximately $52,875 annually, which translates to about $25.42 per hour. However, there’s a significant gap between this figure and the $83,574 needed to live comfortably.
| Salary Metric | Kentucky | National Average | Difference |
|---|---|---|---|
| Average Annual Salary | $52,875 | $65,470 | -19% |
| Median Household Income | $53,804 | $74,580 | -28% |
| Louisville Average | $61,701 | N/A | +17% vs. state |
| Lexington Average | $58,000 | N/A | +10% vs. state |
| Average Hourly Wage | $29.00 | $32.66 | -11% |
According to the Bureau of Labor Statistics, workers in the Louisville metropolitan area earned an average hourly wage of $29.00 in May 2024. Higher-paying occupational groups included management ($57.07/hr), legal ($47.99/hr), and healthcare practitioners ($46.49/hr).
Typical Salaries by Occupation in Kentucky

| Occupational Category | Average Annual Salary | Meets Comfortable Living? |
|---|---|---|
| Management | $105,980 | Yes ✓ |
| Legal | $92,460 | Yes ✓ |
| Healthcare Practitioners | $88,540 | Yes ✓ |
| Computer & Mathematical | $84,790 | Yes ✓ |
| Architecture & Engineering | $81,240 | Near threshold |
| Business & Financial | $73,360 | No |
| Life, Physical, Social Science | $69,820 | No |
| Education & Library | $56,440 | No |
| Installation & Repair | $55,400 | No |
| Construction & Extraction | $53,650 | No |
| Arts, Entertainment, Media | $53,680 | No |
| Community & Social Service | $50,230 | No |
| Transportation & Moving | $48,470 | No |
| Production | $46,650 | No |
| Sales & Related | $44,470 | No |
| Protective Service | $43,120 | No |
| Office & Administrative | $42,450 | No |
| Healthcare Support | $36,610 | No |
| Building & Grounds Cleaning | $33,160 | No |
| Personal Care & Service | $32,550 | No |
| Food Preparation & Serving | $28,790 | No |
Sample Monthly Budgets for Living in Kentucky
Here are realistic monthly budgets for different household types in Kentucky, based on the 50/30/20 rule for comfortable living:
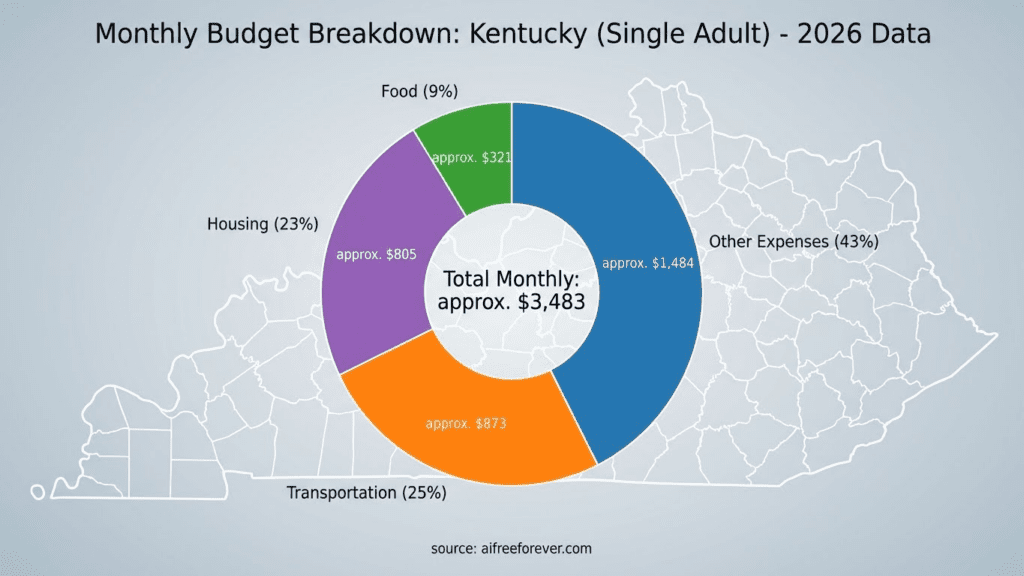
Single Adult Budget (Comfortable Living – $83,574/year)
| Category | Monthly Amount | Percentage |
|---|---|---|
| NEEDS (50%) | $3,482 | |
| Housing (Rent/Mortgage) | $1,200 | 17% |
| Utilities | $400 | 6% |
| Groceries | $350 | 5% |
| Transportation | $875 | 13% |
| Healthcare | $257 | 4% |
| Insurance | $200 | 3% |
| Phone/Internet | $150 | 2% |
| Minimum Debt Payments | $50 | 1% |
| WANTS (30%) | $2,089 | |
| Dining Out | $400 | 6% |
| Entertainment | $300 | 4% |
| Shopping | $400 | 6% |
| Hobbies | $300 | 4% |
| Travel/Vacation | $400 | 6% |
| Personal Care | $150 | 2% |
| Subscriptions | $139 | 2% |
| SAVINGS (20%) | $1,393 | |
| Retirement (401k/IRA) | $800 | 11% |
| Emergency Fund | $350 | 5% |
| Extra Debt Payoff | $243 | 4% |
| TOTAL | $6,965 | 100% |
Family of Four Budget (Comfortable Living – $192,941/year)
| Category | Monthly Amount | Percentage |
|---|---|---|
| NEEDS (50%) | $8,039 | |
| Housing (Rent/Mortgage) | $2,200 | 14% |
| Utilities | $550 | 3% |
| Groceries | $940 | 6% |
| Transportation (2 vehicles) | $1,465 | 9% |
| Childcare | $1,336 | 8% |
| Healthcare | $742 | 5% |
| Insurance | $450 | 3% |
| Phone/Internet | $200 | 1% |
| Minimum Debt Payments | $156 | 1% |
| WANTS (30%) | $4,823 | |
| Dining Out | $600 | 4% |
| Entertainment | $500 | 3% |
| Kids Activities | $600 | 4% |
| Shopping | $700 | 4% |
| Family Vacation | $800 | 5% |
| Education Extras | $400 | 2% |
| Miscellaneous | $1,223 | 8% |
| SAVINGS (20%) | $3,216 | |
| Retirement | $1,500 | 9% |
| Emergency Fund | $600 | 4% |
| College Fund (529) | $600 | 4% |
| Extra Debt Payoff | $516 | 3% |
| TOTAL | $16,078 | 100% |
How Does Kentucky Compare to Neighboring States?
Kentucky offers one of the most affordable lifestyles in the region. Here’s how it compares to surrounding states:
| State | Salary for Comfortable Living (Single) | Salary for Family of 4 | Cost of Living Index |
|---|---|---|---|
| West Virginia | $80,829 | $189,000 | 84 |
| Kentucky | $83,574 | $192,941 | 92 |
| Tennessee | $86,500 | $198,000 | 93 |
| Indiana | $87,200 | $200,500 | 94 |
| Ohio | $88,400 | $203,000 | 95 |
| Missouri | $85,100 | $195,600 | 91 |
| Virginia | $98,500 | $225,000 | 103 |
| National Average | $96,500 | $235,000 | 100 |
Frequently Asked Questions About Living Costs in Kentucky
Can you live comfortably on $50,000 a year in Kentucky?
While $50,000 allows you to cover basic necessities in most Kentucky cities, it falls short of the $83,574 needed for truly comfortable living under the 50/30/20 rule. You can live adequately but may need to limit discretionary spending and reduce savings contributions.
What is considered a good salary in Kentucky?
A salary between $50,000 and $75,000 is generally considered good for a single person in Kentucky, providing adequate coverage of expenses with some room for savings. However, $83,574+ is needed for comfortable living with full retirement savings and discretionary spending capacity.
Is Kentucky cheaper than most states?
Yes, Kentucky ranks as the 5th most affordable state for single adults and the 2nd most affordable for families of four. The cost of living is approximately 8% below the national average, with housing costs particularly favorable.
What is the most affordable city in Kentucky?
Paducah offers some of the most affordable living in Kentucky, with median home prices around $161,000 and average rents of $775 for a one-bedroom apartment. Other affordable cities include Hopkinsville, Bowling Green, and Frankfort.
How much do I need to afford rent in Kentucky?
Using the 30% rule (spending no more than 30% of income on housing), you need an annual income of approximately $42,840 to afford the average Kentucky rent of $1,071/month, or about $20.60 per hour working full-time.
Is Kentucky a good state for retirement?
Kentucky offers moderate retirement benefits with Social Security income exempt from state taxes and up to $31,110 in pension/retirement income exempt per person. Combined with low housing costs and affordable healthcare, it can be an attractive retirement destination.
Why is Kentucky so affordable?
Kentucky’s affordability stems from lower housing costs (22% below national average), competitive utility rates, lower property taxes (0.73% vs. 1.1% national average), and a lower overall cost of goods and services driven by the state’s economic mix.