

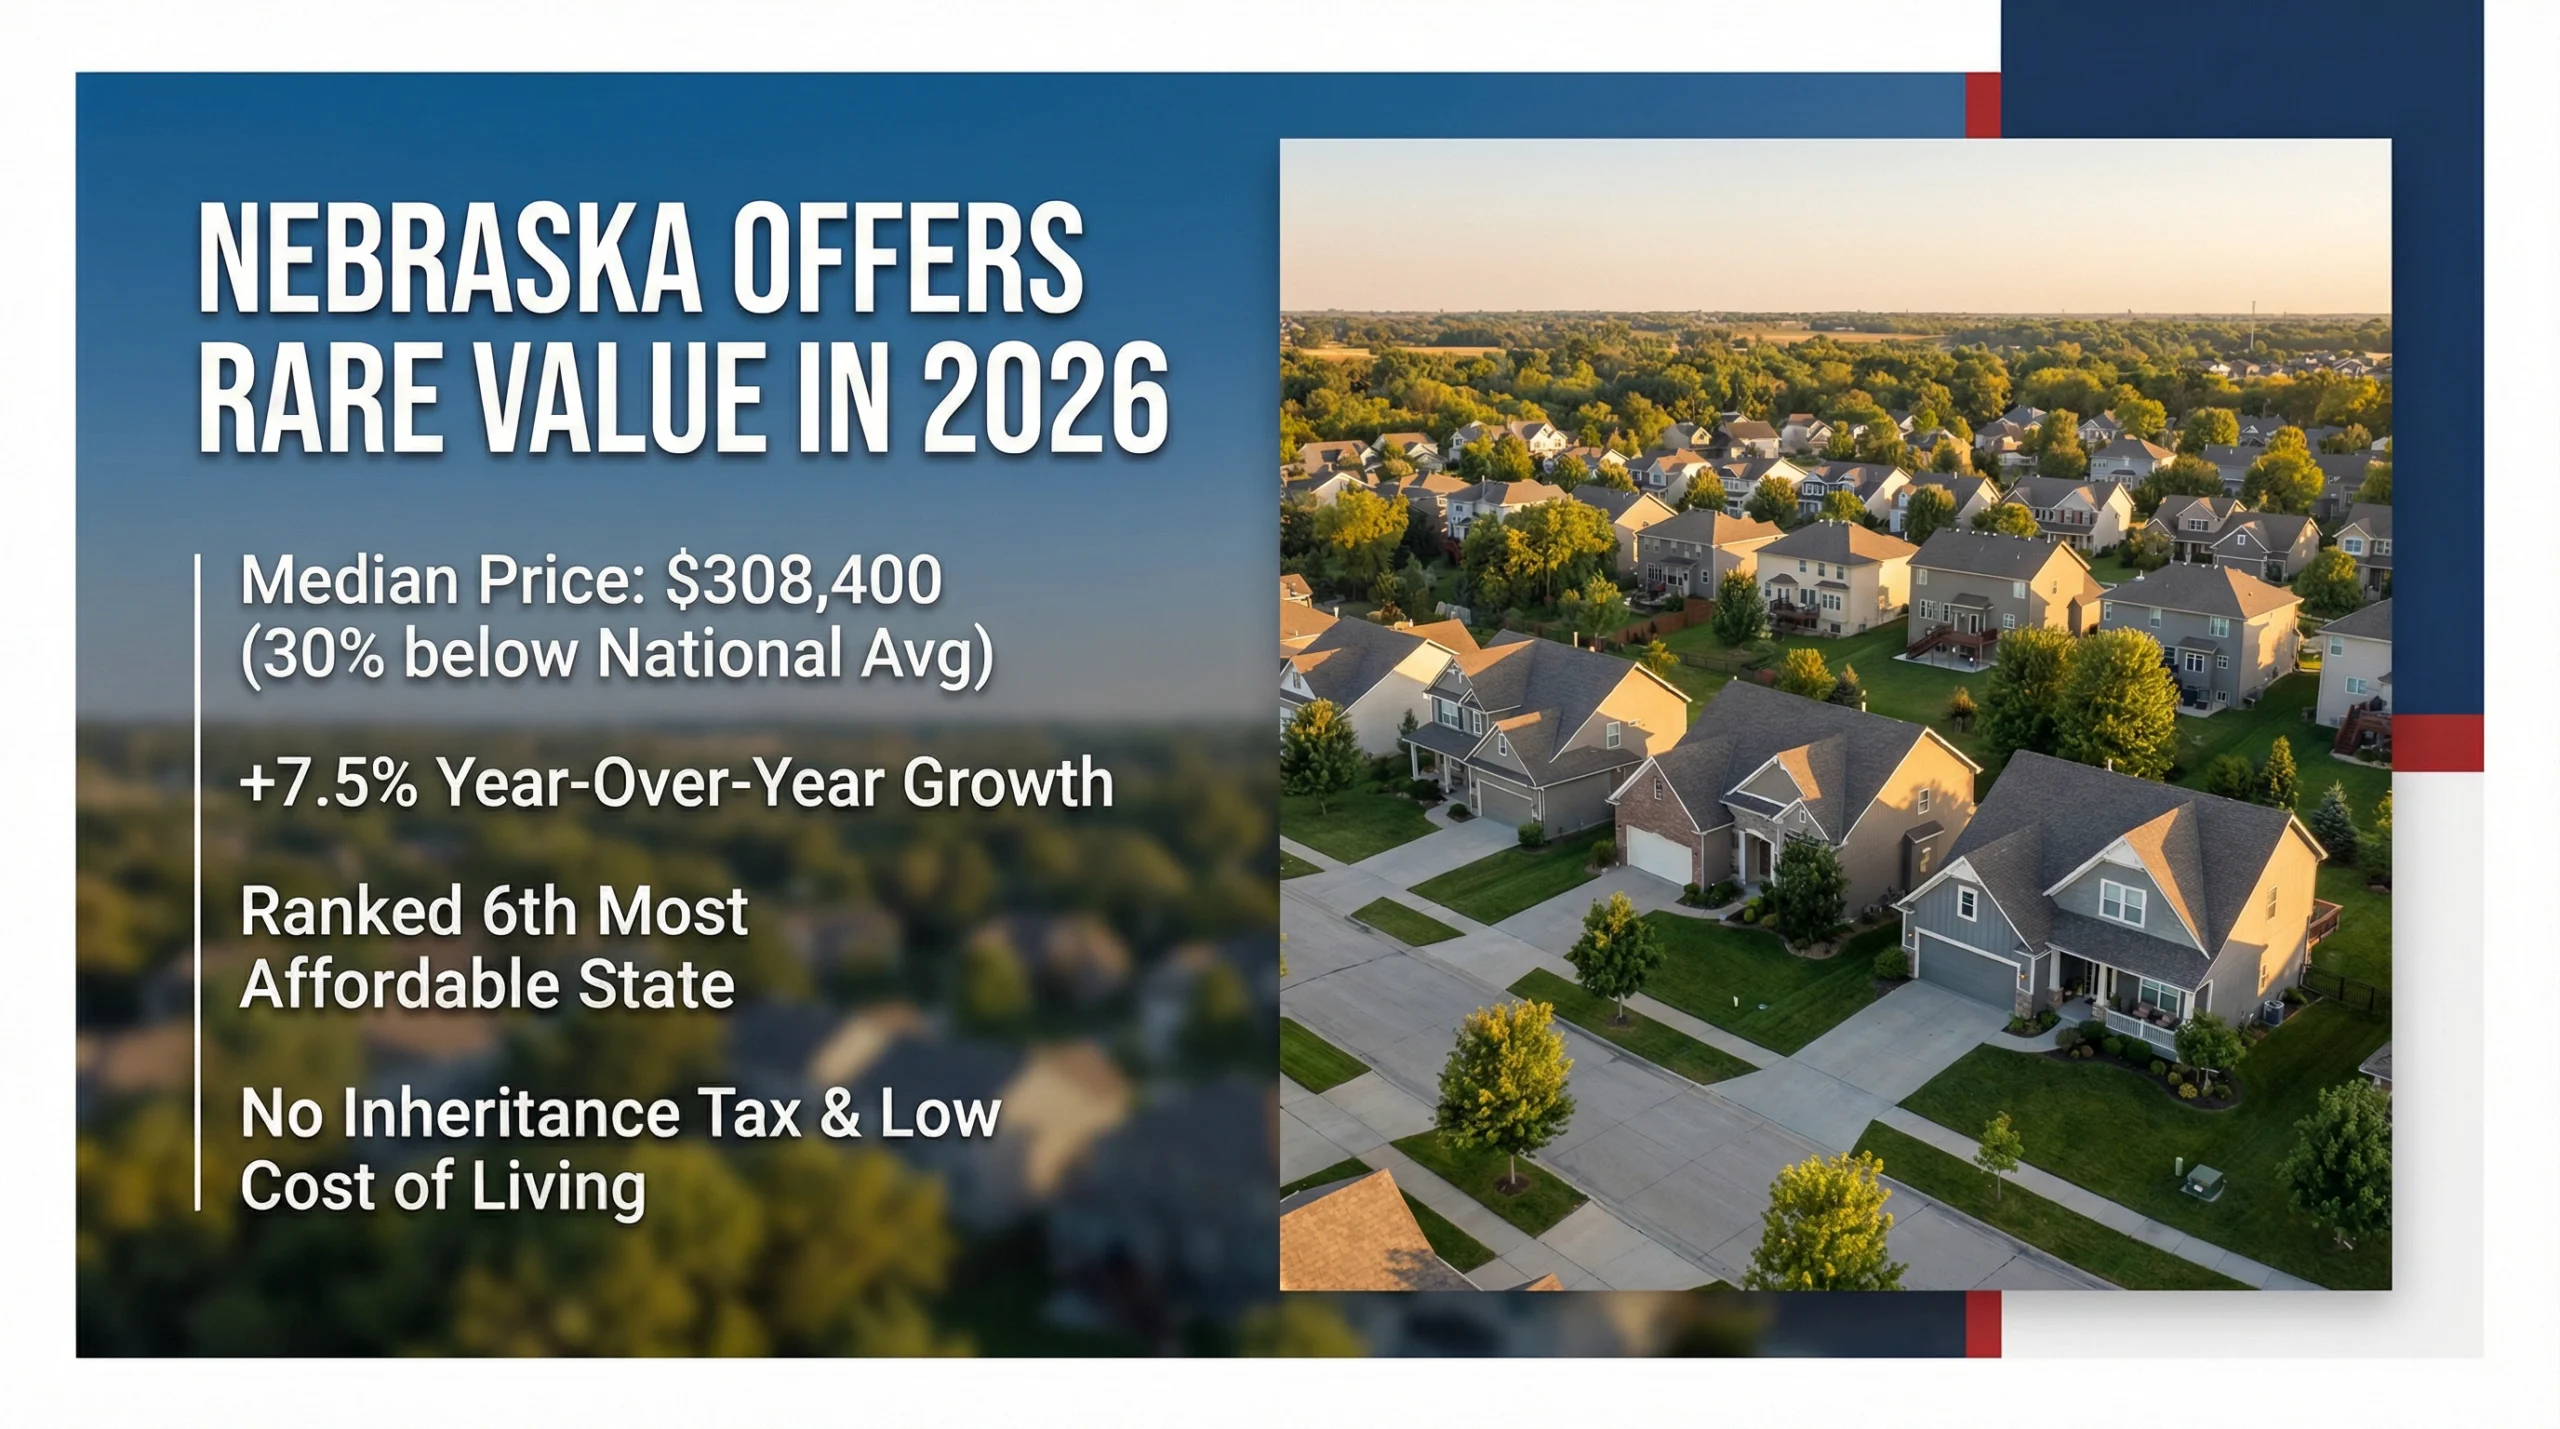
Nebraska’s housing market offers something rare in 2026: affordable homes that are still gaining value. While coastal markets have million-dollar prices, Nebraska’s median is $308,400 according to Redfin data. That’s 29-35% below the national median. Prices climbed 7.5% year-over-year in late 2025.
Nebraska has no inheritance tax, low property taxes, and a cost of living 10% below national averages. Omaha and Lincoln lead the market with strong job growth. Smaller cities like Grand Island and Bellevue attract buyers seeking value. This guide covers current prices, market trends, and expert forecasts for Nebraska real estate through 2026.
What Are Current Home Prices Across Nebraska?
Nebraska home prices vary by metro area. Zillow’s Home Value Index puts the statewide average at $276,477. Redfin reports a higher median sale price of $308,400. The difference comes from methodology: Zillow estimates all homes while Redfin tracks actual sales.
| City/Area | Median Sale Price | YoY Change | Days on Market |
|---|---|---|---|
| Nebraska (Statewide) | $308,400 | +7.5% | 30 |
| Lincoln | $314,000 | +8.8% | 23 |
| Omaha | $285,000 | +5.6% | 22 |
| Grand Island | $295,000 | +13.3% | 38 |
| Bellevue | $283,000 | -0.5% | 19 |
The statewide median of $308,400 puts Nebraska among the 6th most affordable states for homebuyers according to Clever Real Estate research. The affordability score of 4.1 shows it takes just 4.1 years of median household income ($74,590) to afford the median home price.
How Does Nebraska Compare to National Averages?
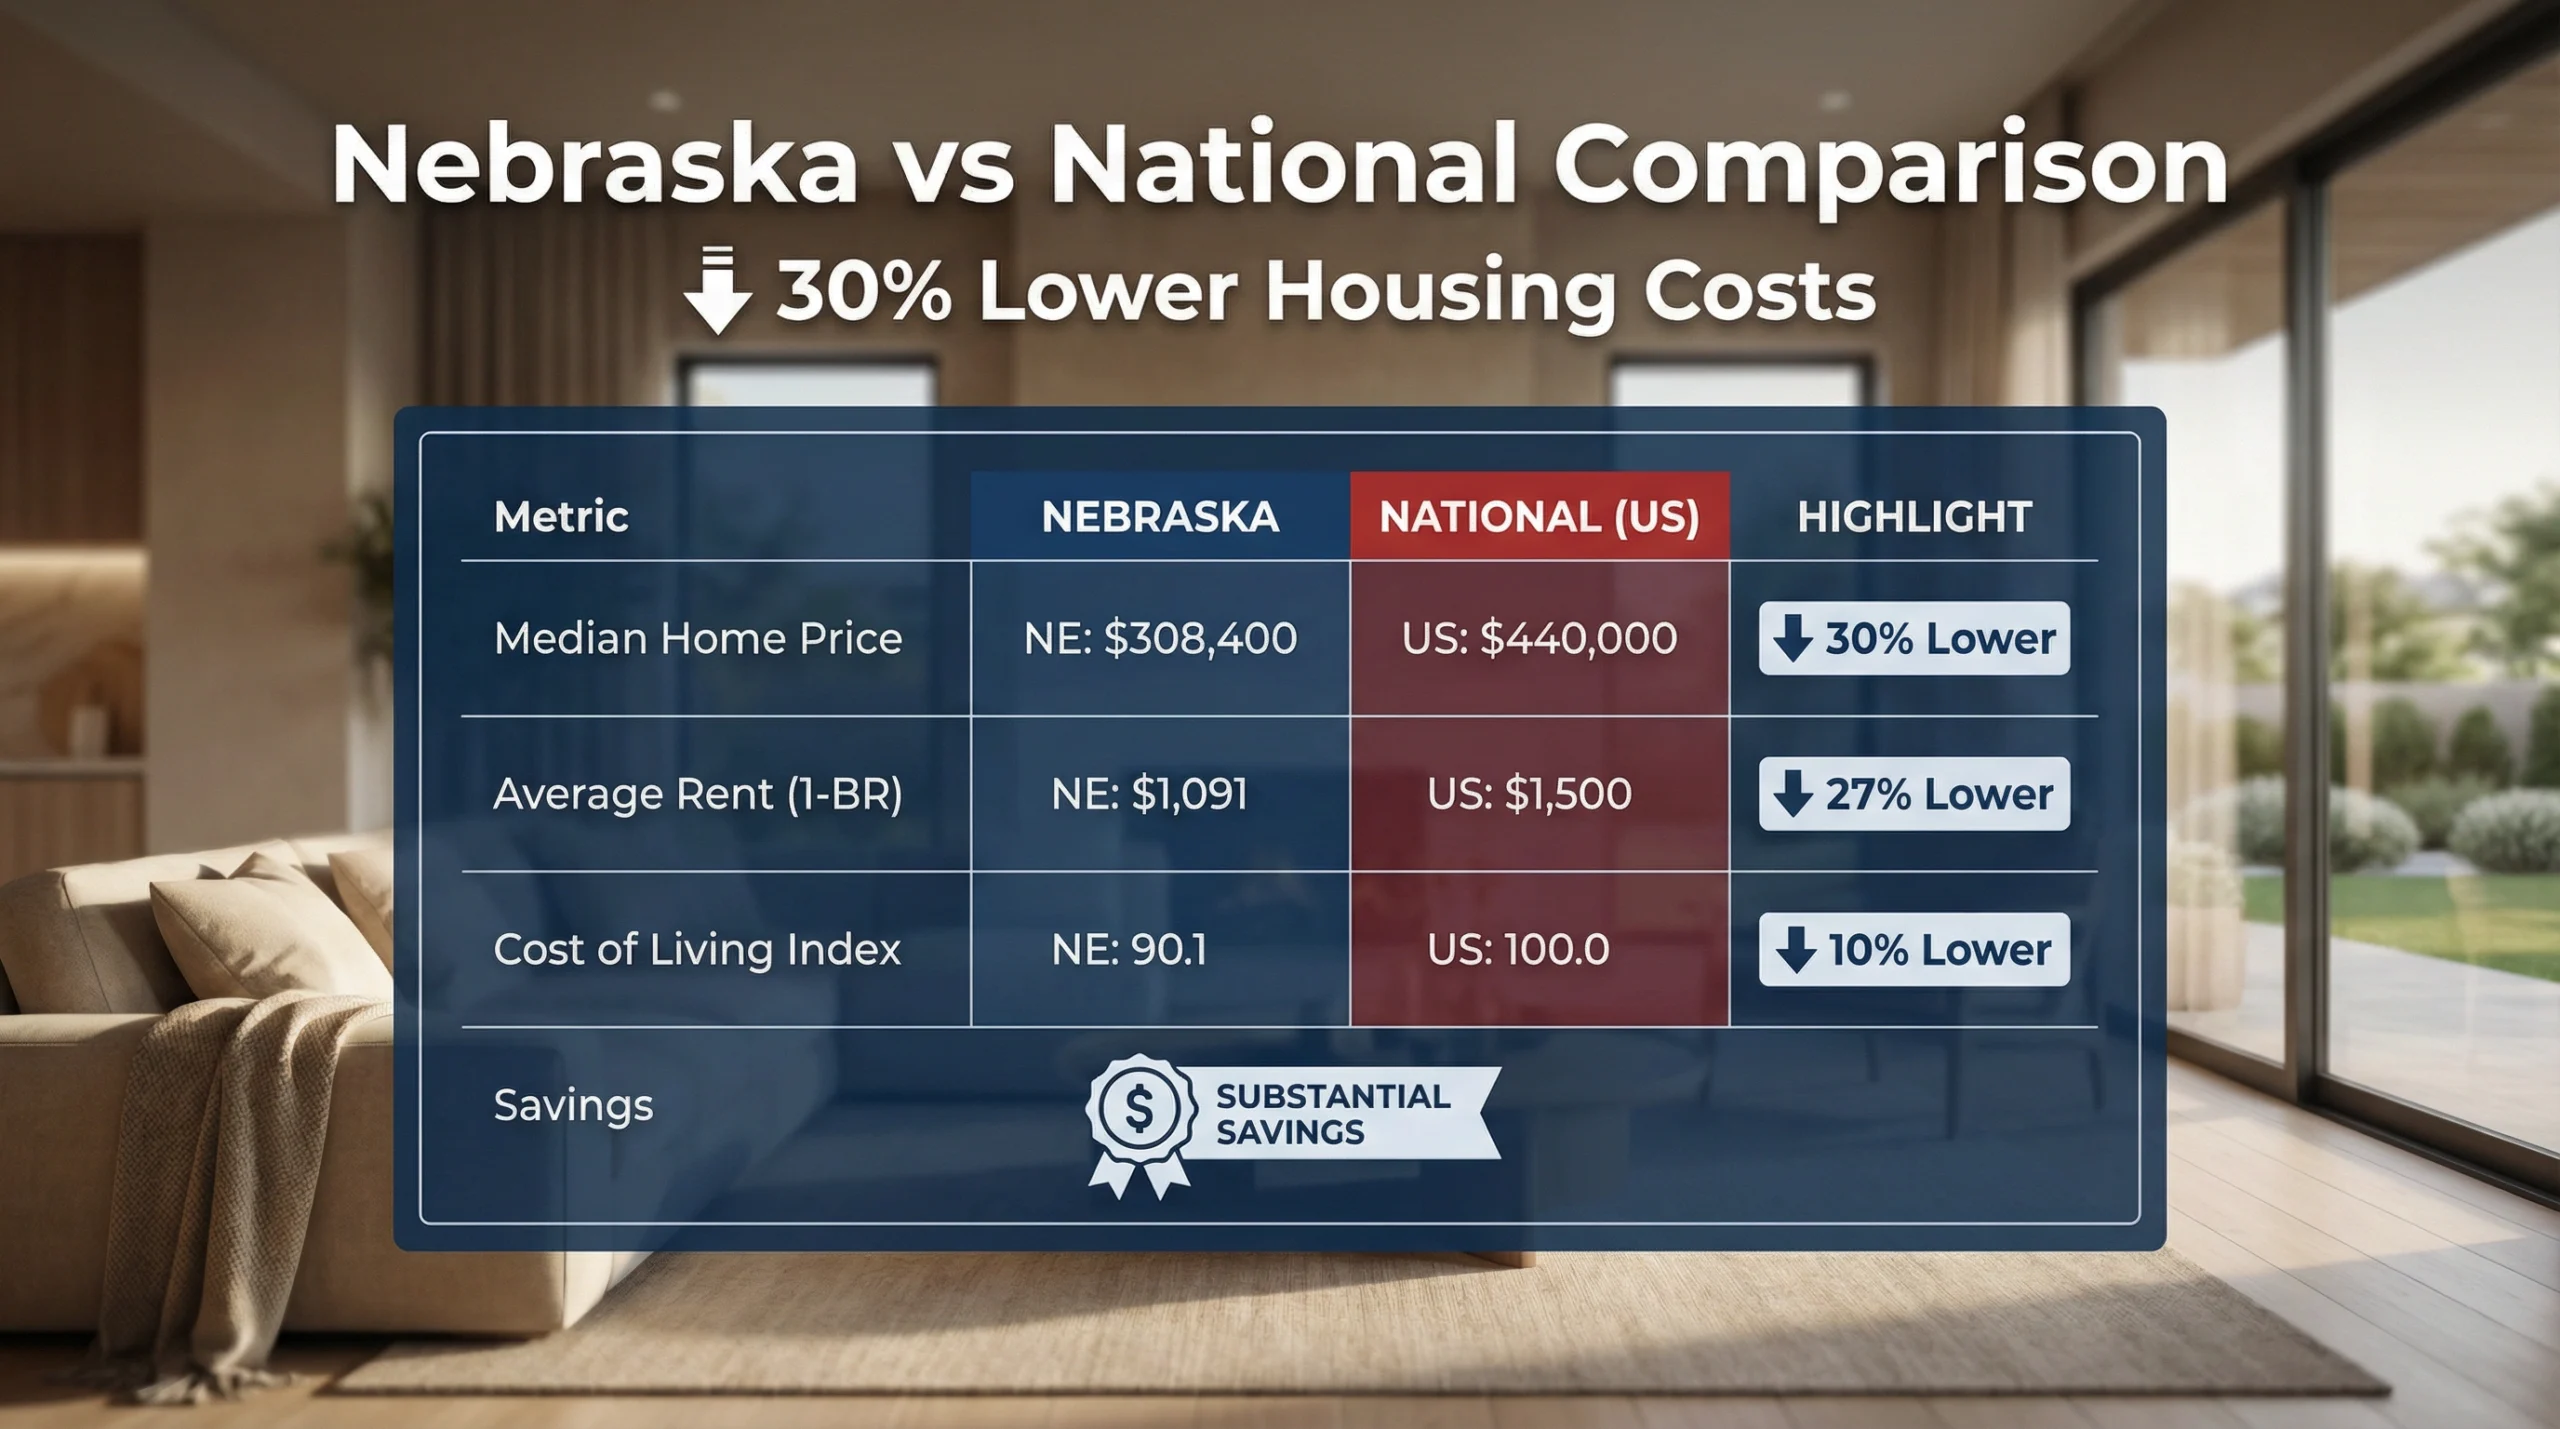
Nebraska housing costs are lower than national averages across every measure. The state’s cost of living index is 90.1, meaning residents pay about 10% less than typical Americans for goods and services. Housing provides the biggest savings.
| Metric | Nebraska | National Average | Difference |
|---|---|---|---|
| Median Home Price | $308,400 | $440,000 | 30% lower |
| Average Rent (1-BR) | $1,091 | $1,500 | 27% lower |
| Cost of Living Index | 90.1 | 100 | 10% lower |
| Housing Index | 78.4 | 100 | 22% lower |
| Property Tax Rate | 1.63% | 1.1% | Higher |
Houzeo data shows Nebraska’s housing index of 78.4 means prices are 21.6% below national levels. The trade-off is property taxes at 1.63%, which rank among the higher rates nationally. On a $308,400 home, expect about $5,027 annually in property taxes.
What’s Happening in the Omaha Housing Market?
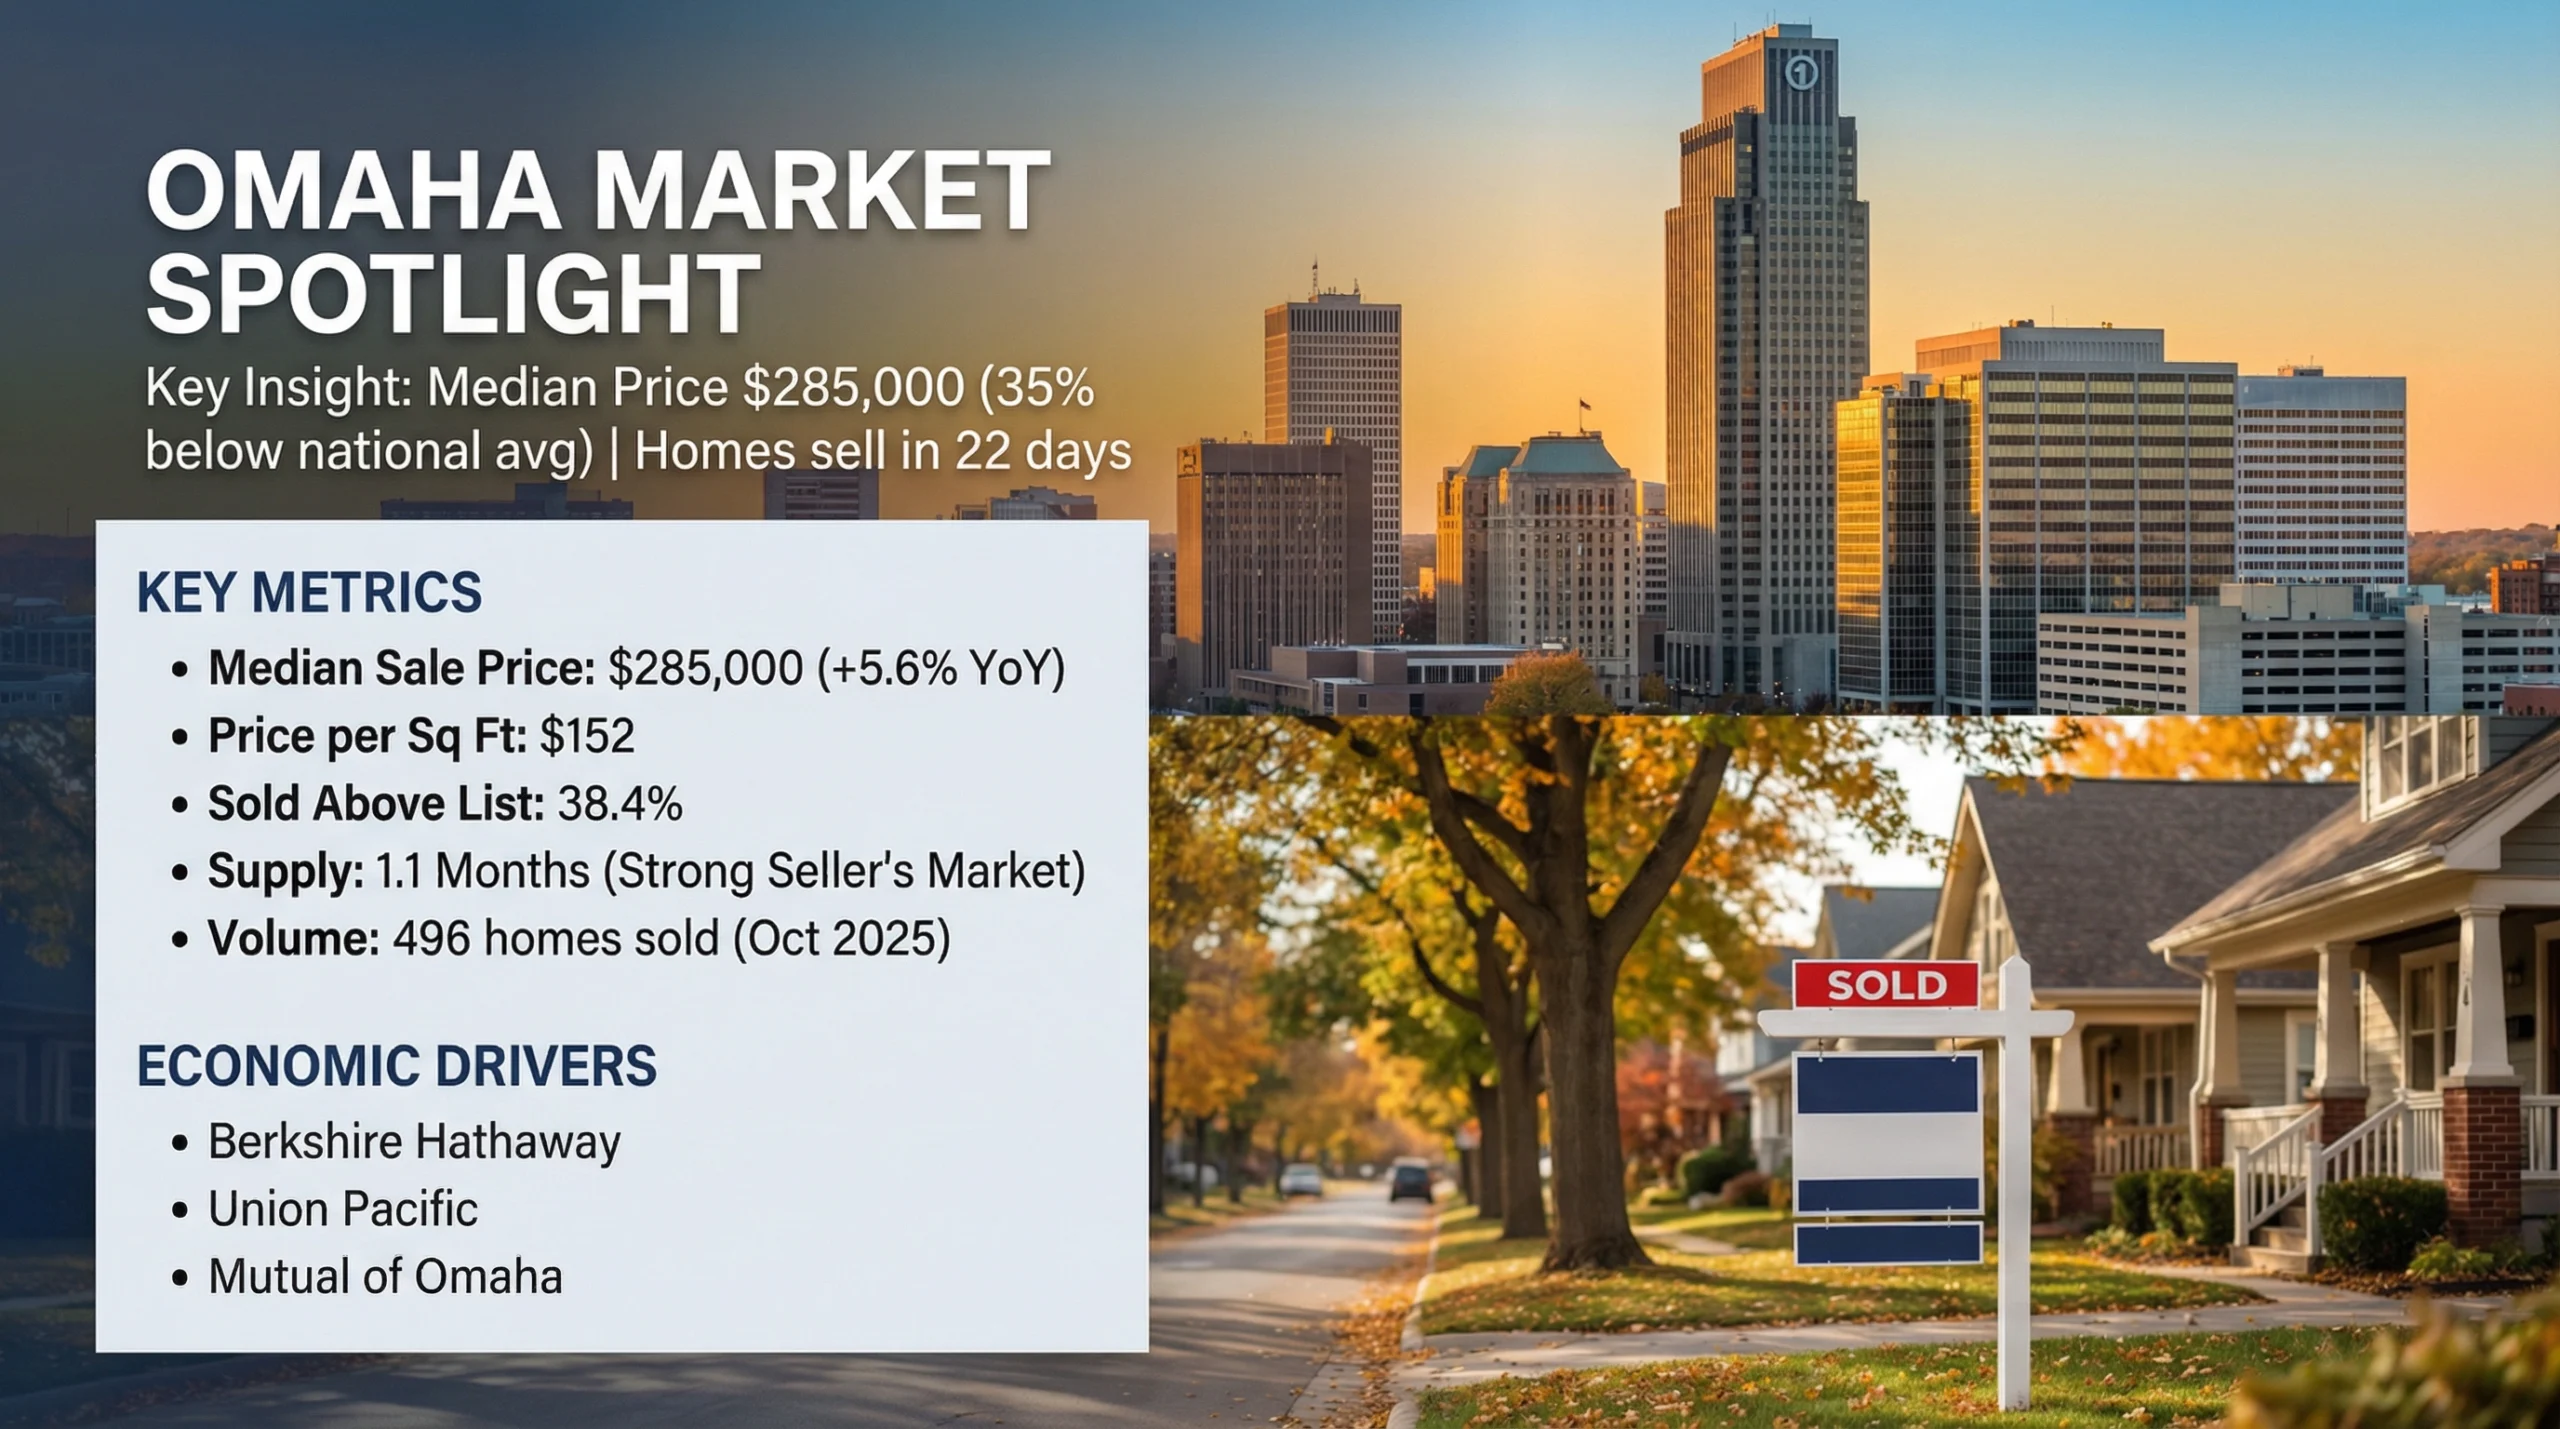
Omaha drives Nebraska’s real estate market as the state’s largest metro with nearly 500,000 residents. The market remains competitive with homes selling in just 22 days on average.
| Omaha Metric | Current Value | Year-Over-Year Change |
|---|---|---|
| Median Sale Price | $285,000 | +5.6% |
| Average Home Value (Zillow) | $286,166 | +0.8% |
| Price Per Square Foot | $152 | 0% |
| Days on Market | 22 | +7 days |
| Homes Sold Above List | 38.4% | Competitive |
| Months of Supply | 1.1 | Seller’s market |
Redfin reports Omaha’s median sale price of $285,000 is 35% below the national average. The market saw 496 homes sold in October 2025, up from 416 the previous year. This shows strengthening demand despite higher mortgage rates.
Omaha’s cost of living is 10% below national averages according to Redfin’s analysis. Major employers including Berkshire Hathaway, Union Pacific Railroad, and Mutual of Omaha keep the economy stable and support housing demand.
Omaha Neighborhood Price Ranges
RentCafe data shows significant price differences across Omaha neighborhoods.
| Neighborhood Type | Avg 1-BR Rent | Home Price Range |
|---|---|---|
| Budget (Hanscom Park, North Omaha) | $695-$980 | $150,000-$250,000 |
| Mid-Range (Dundee, Benson) | $1,100-$1,300 | $250,000-$400,000 |
| Premium (Aksarben-Elmwood, Fire Ridge) | $1,500-$1,883 | $400,000-$700,000+ |
What’s Happening in the Lincoln Housing Market?
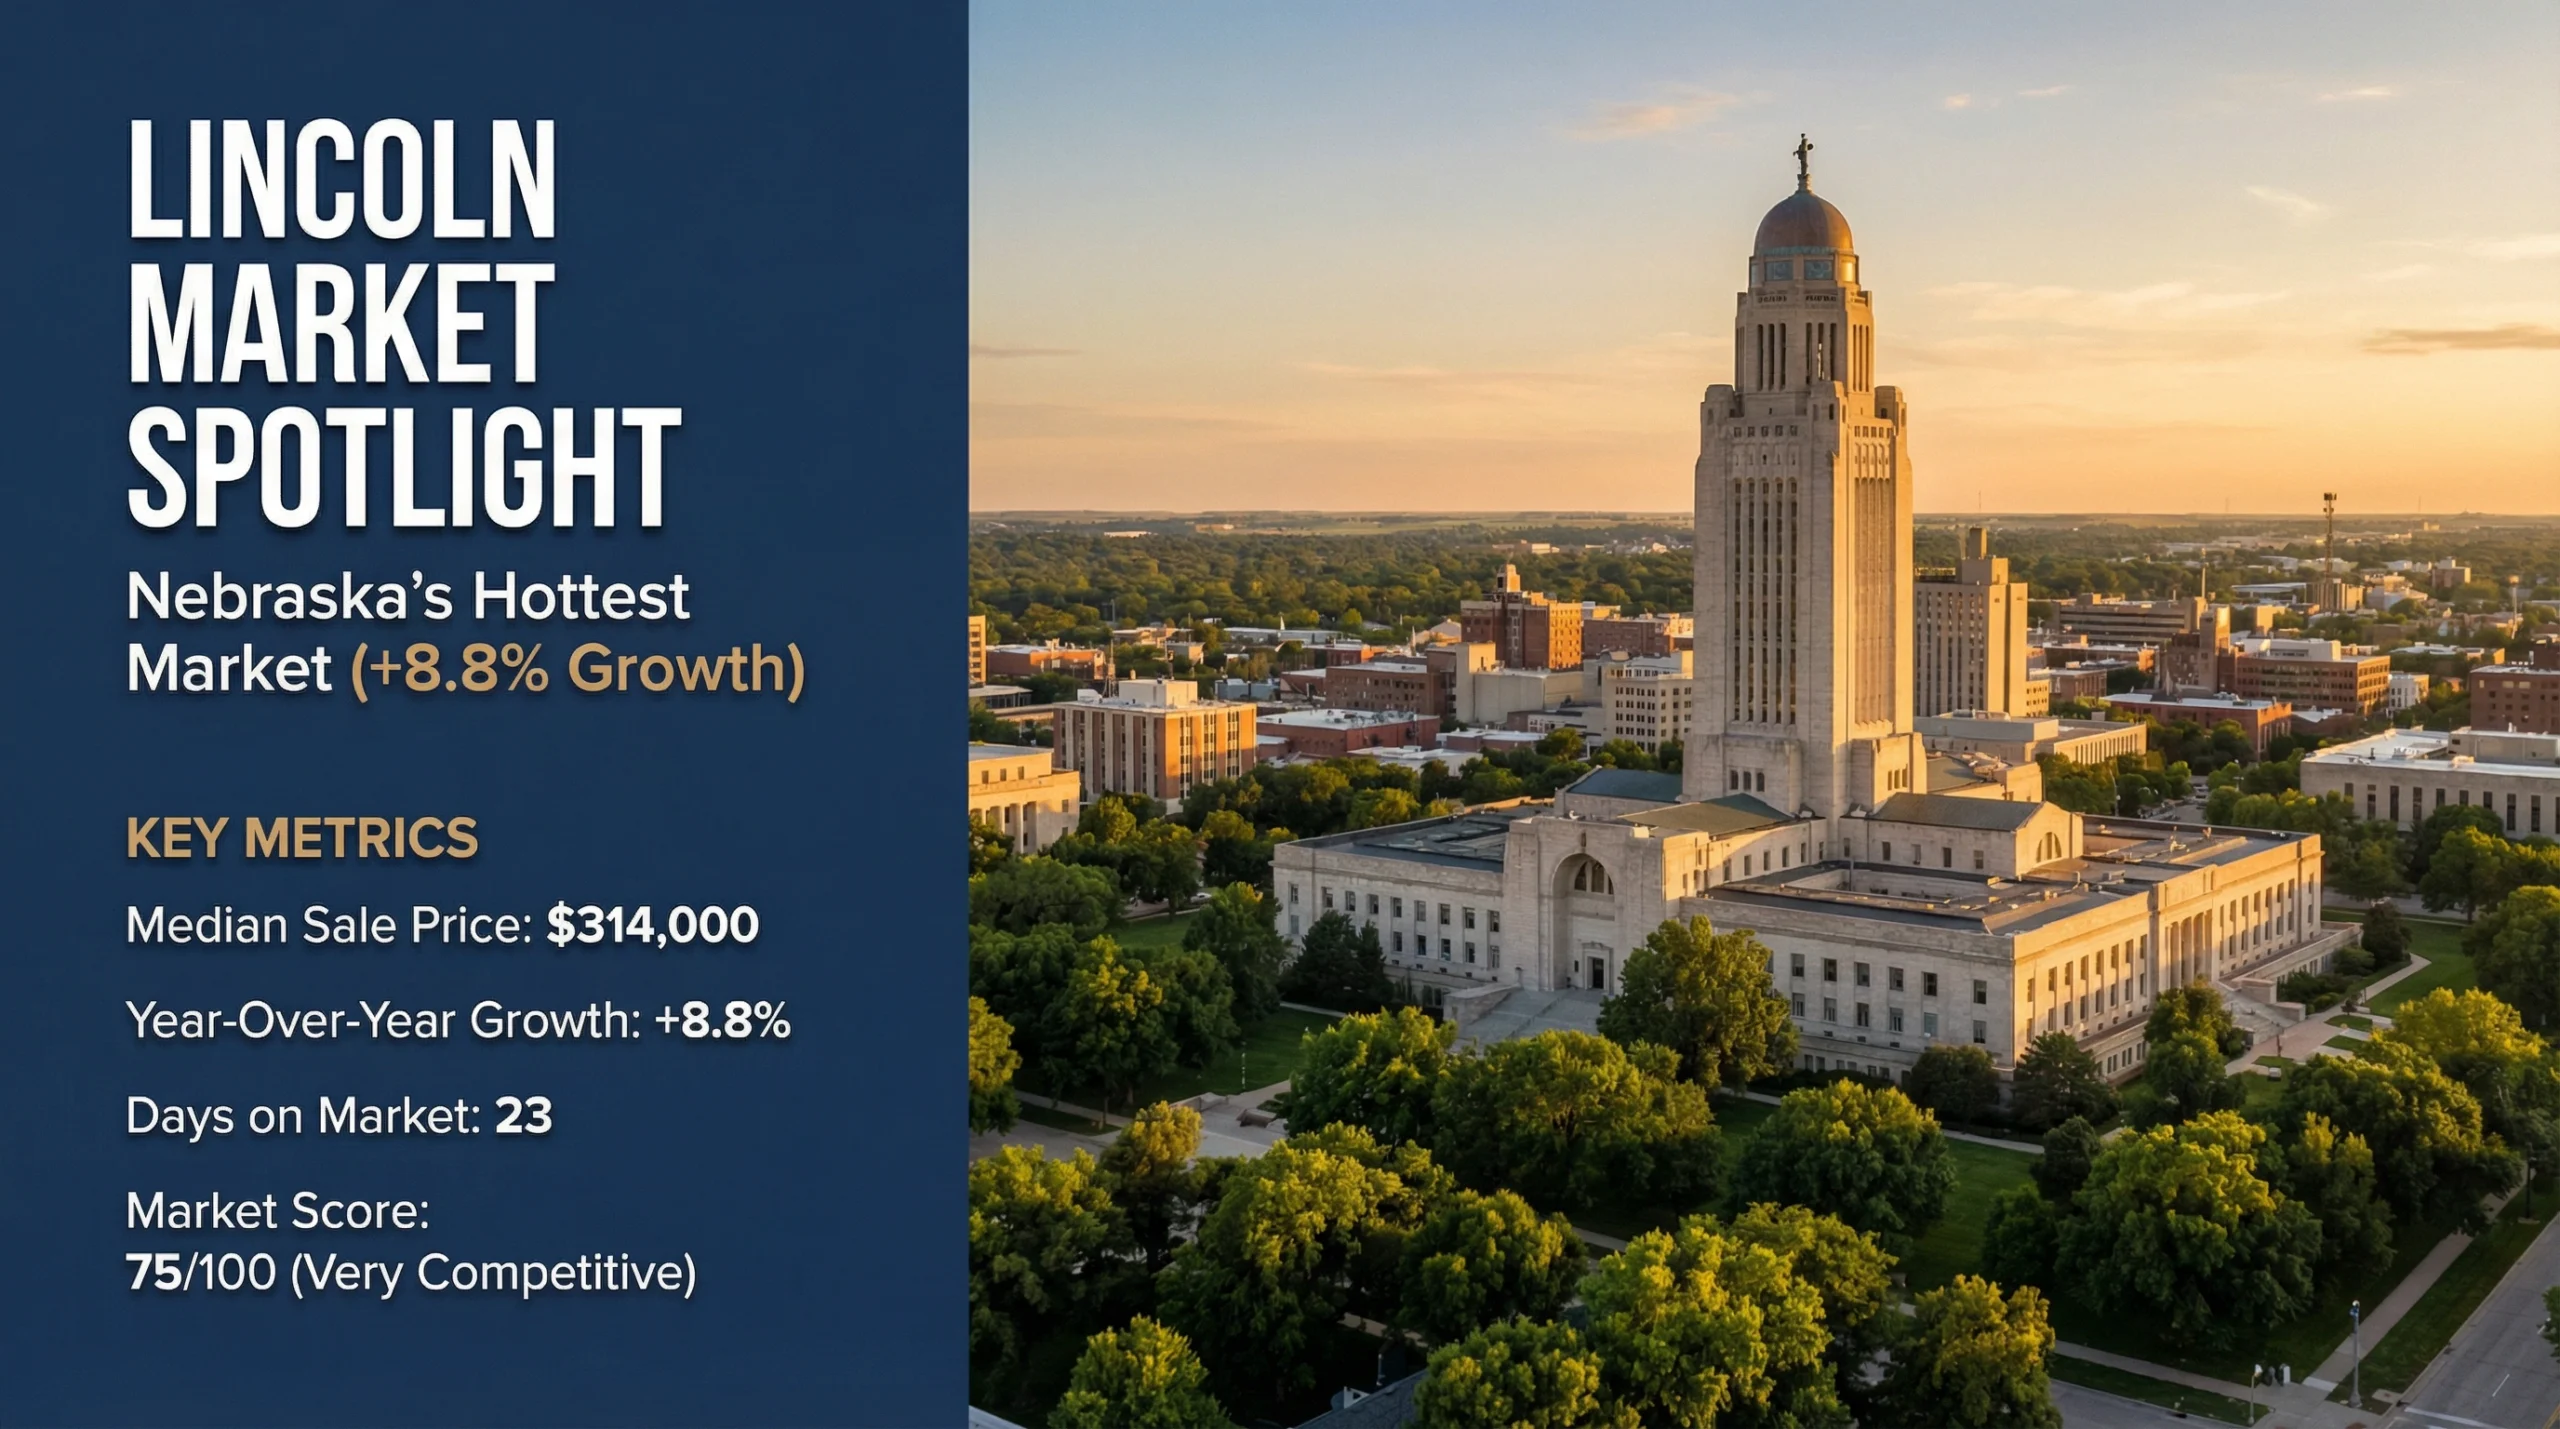
Lincoln has strong price appreciation. The median sale price reached $314,000 in late 2025. This is up 8.8% year-over-year according to Redfin data.
| Lincoln Metric | Current Value | Year-Over-Year Change |
|---|---|---|
| Median Sale Price | $314,000 | +8.8% |
| Average Home Value (Zillow) | $273,960 | +3.7% |
| Price Per Square Foot | $163 | +7.6% |
| Days on Market | 23 | +2 days |
| Homes Sold | 315 | +6.1% |
| Market Temperature | Very Competitive | Score: 75/100 |
Norada Real Estate reports Lincoln is 29% more affordable than the national median. The University of Nebraska-Lincoln, Bryan Health, and state government provide steady jobs. The city’s 2.6% unemployment rate is below national averages.
Lincoln’s rental market runs slightly above state averages. RentCafe shows average rent at $1,334 monthly. Affordable neighborhoods like South 48th Street have units around $985.
Which Nebraska Cities Show the Strongest Growth?
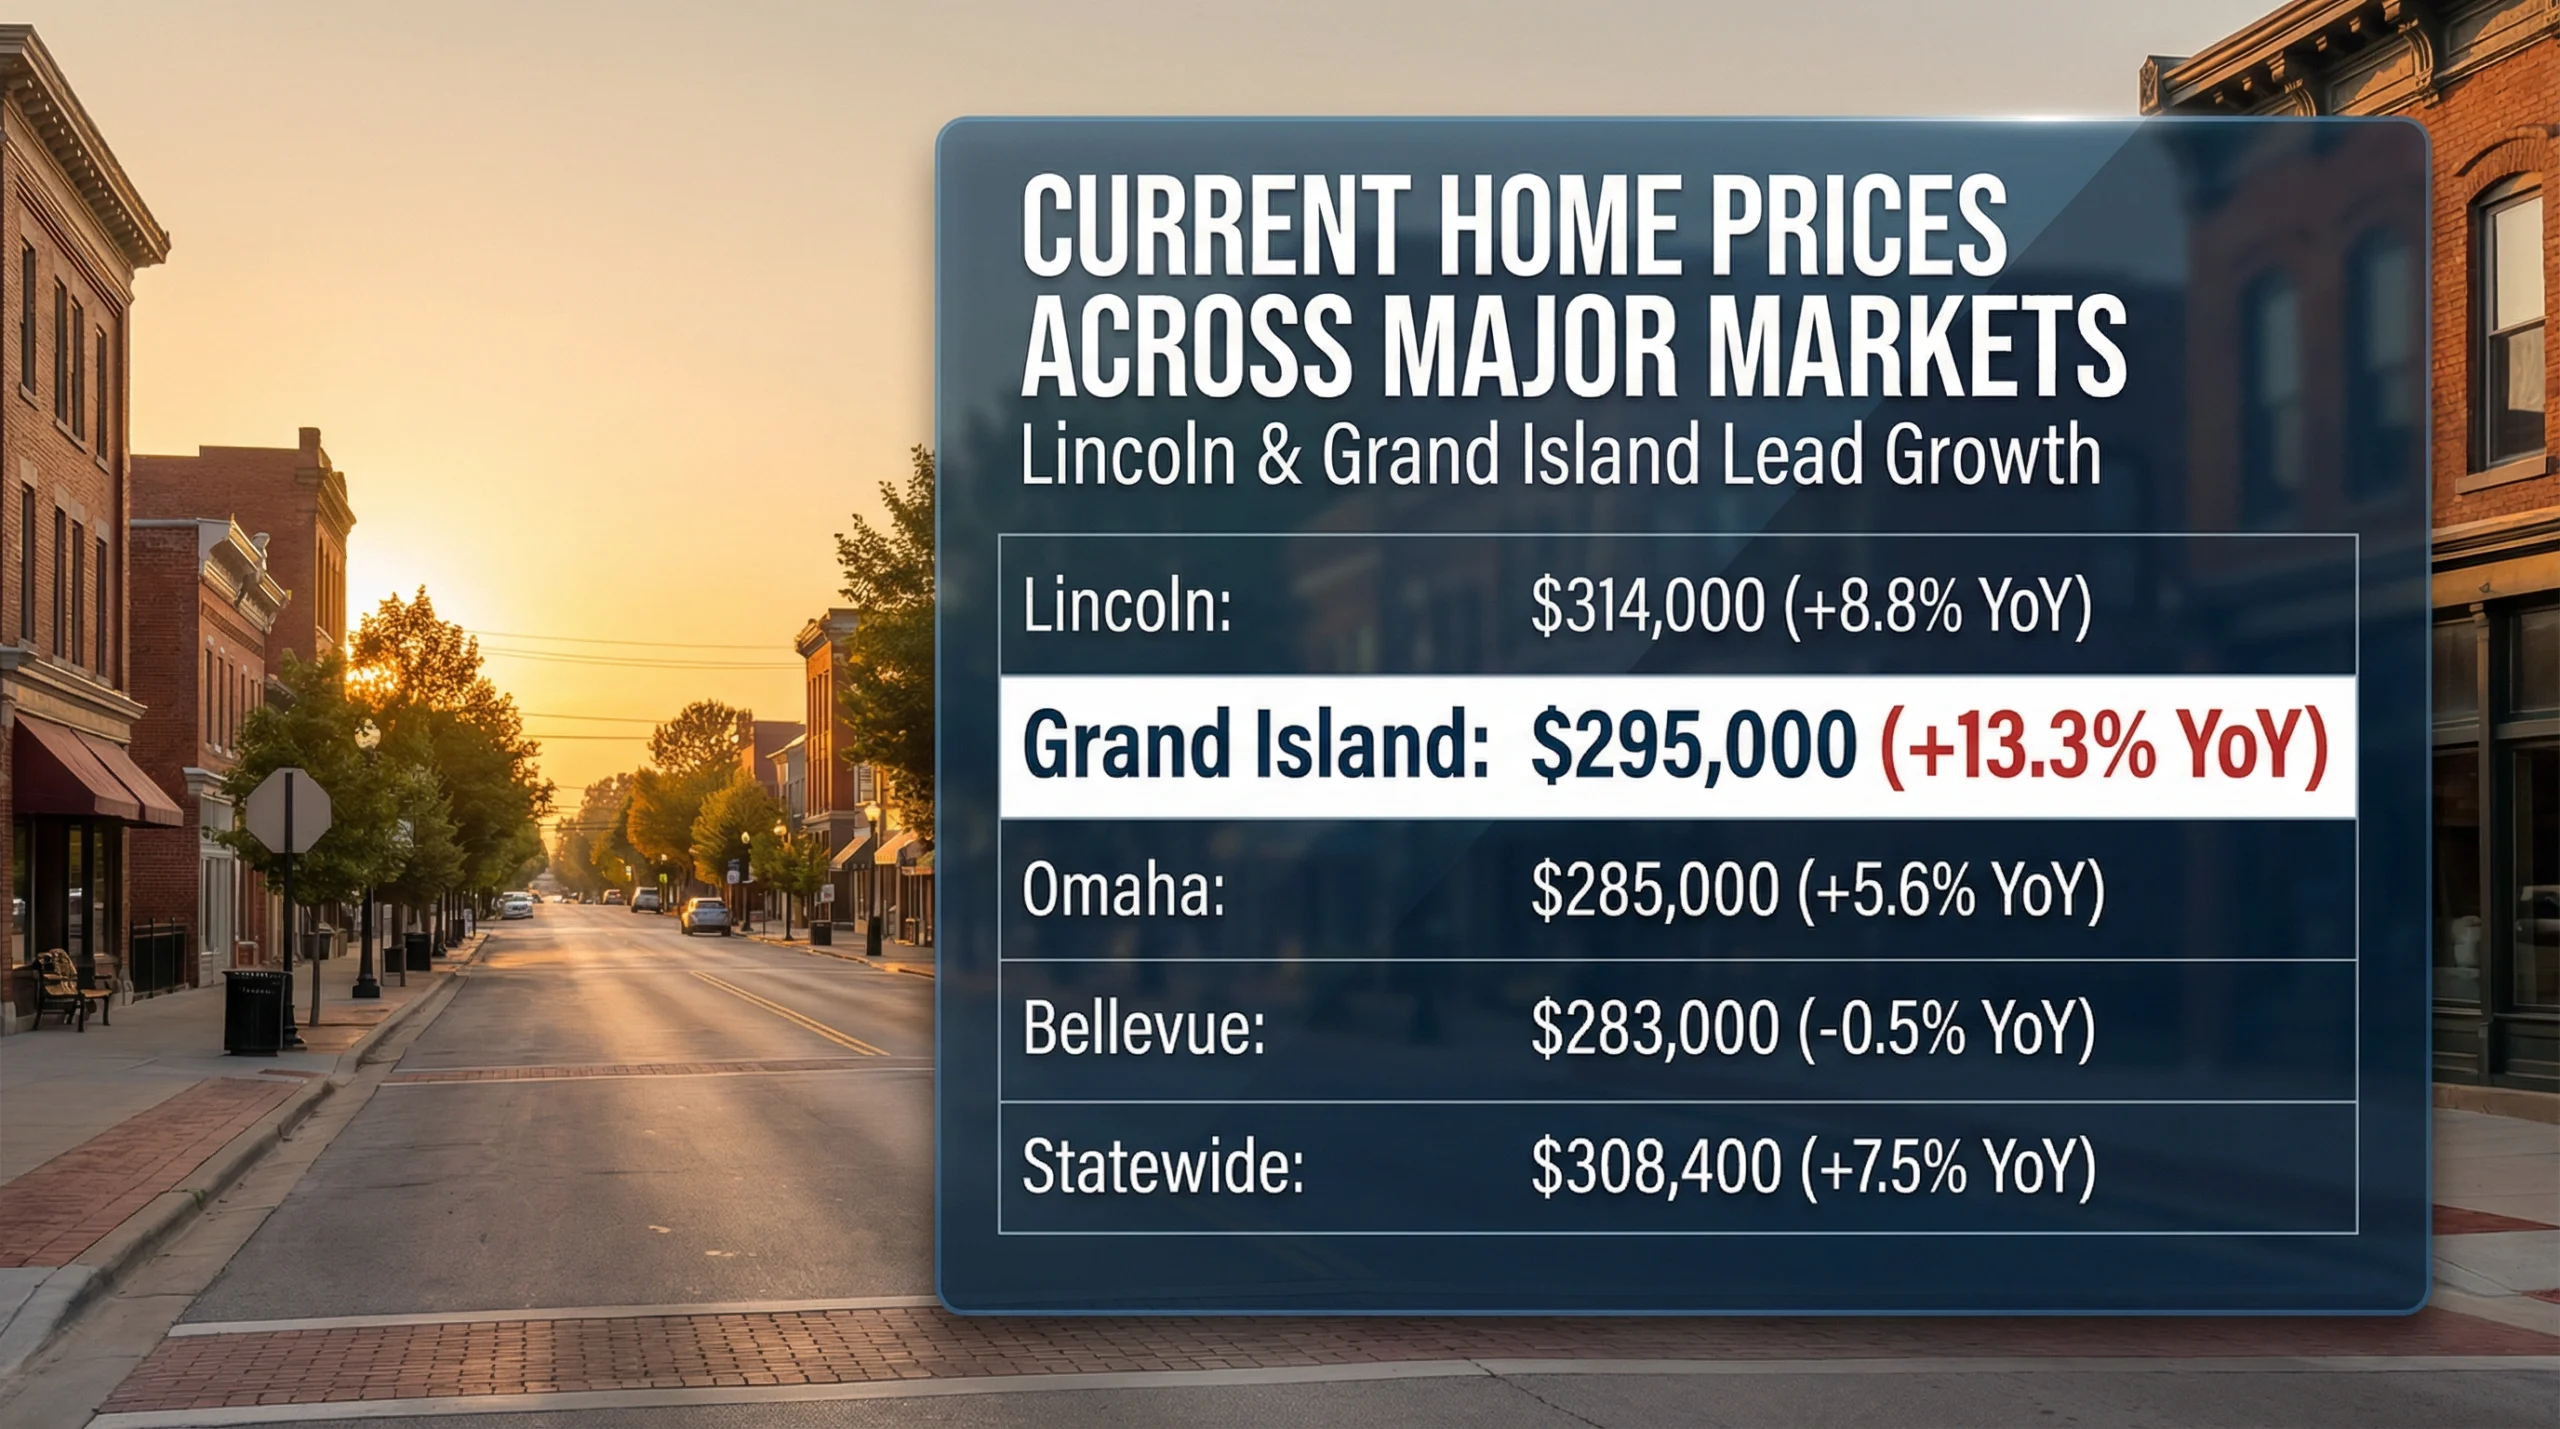
Several Nebraska markets beat state averages in 2025. Grand Island’s appreciation led at 13.3%. These smaller markets attract buyers priced out of Omaha and Lincoln.
| City | Median Price | YoY Growth | Key Drivers |
|---|---|---|---|
| Grand Island | $295,000 | +13.3% | Infrastructure investment, family migration |
| Lincoln | $314,000 | +8.8% | University, state government, healthcare |
| Kearney | $270,000 | +5-7% | University, schools, multi-family development |
| Omaha | $285,000 | +5.6% | Corporate headquarters, population growth |
| Bellevue | $283,000 | -0.5% | Offutt AFB, Omaha proximity |
Grand Island’s surge reflects families seeking affordable housing and strong schools. The city’s median single-family home price is $270,000 according to Homes.com. This provides entry points well below metro markets. The Nebraska State Fair and Fonner Park add lifestyle appeal.
What Do Inventory Levels Tell Us About the Market?
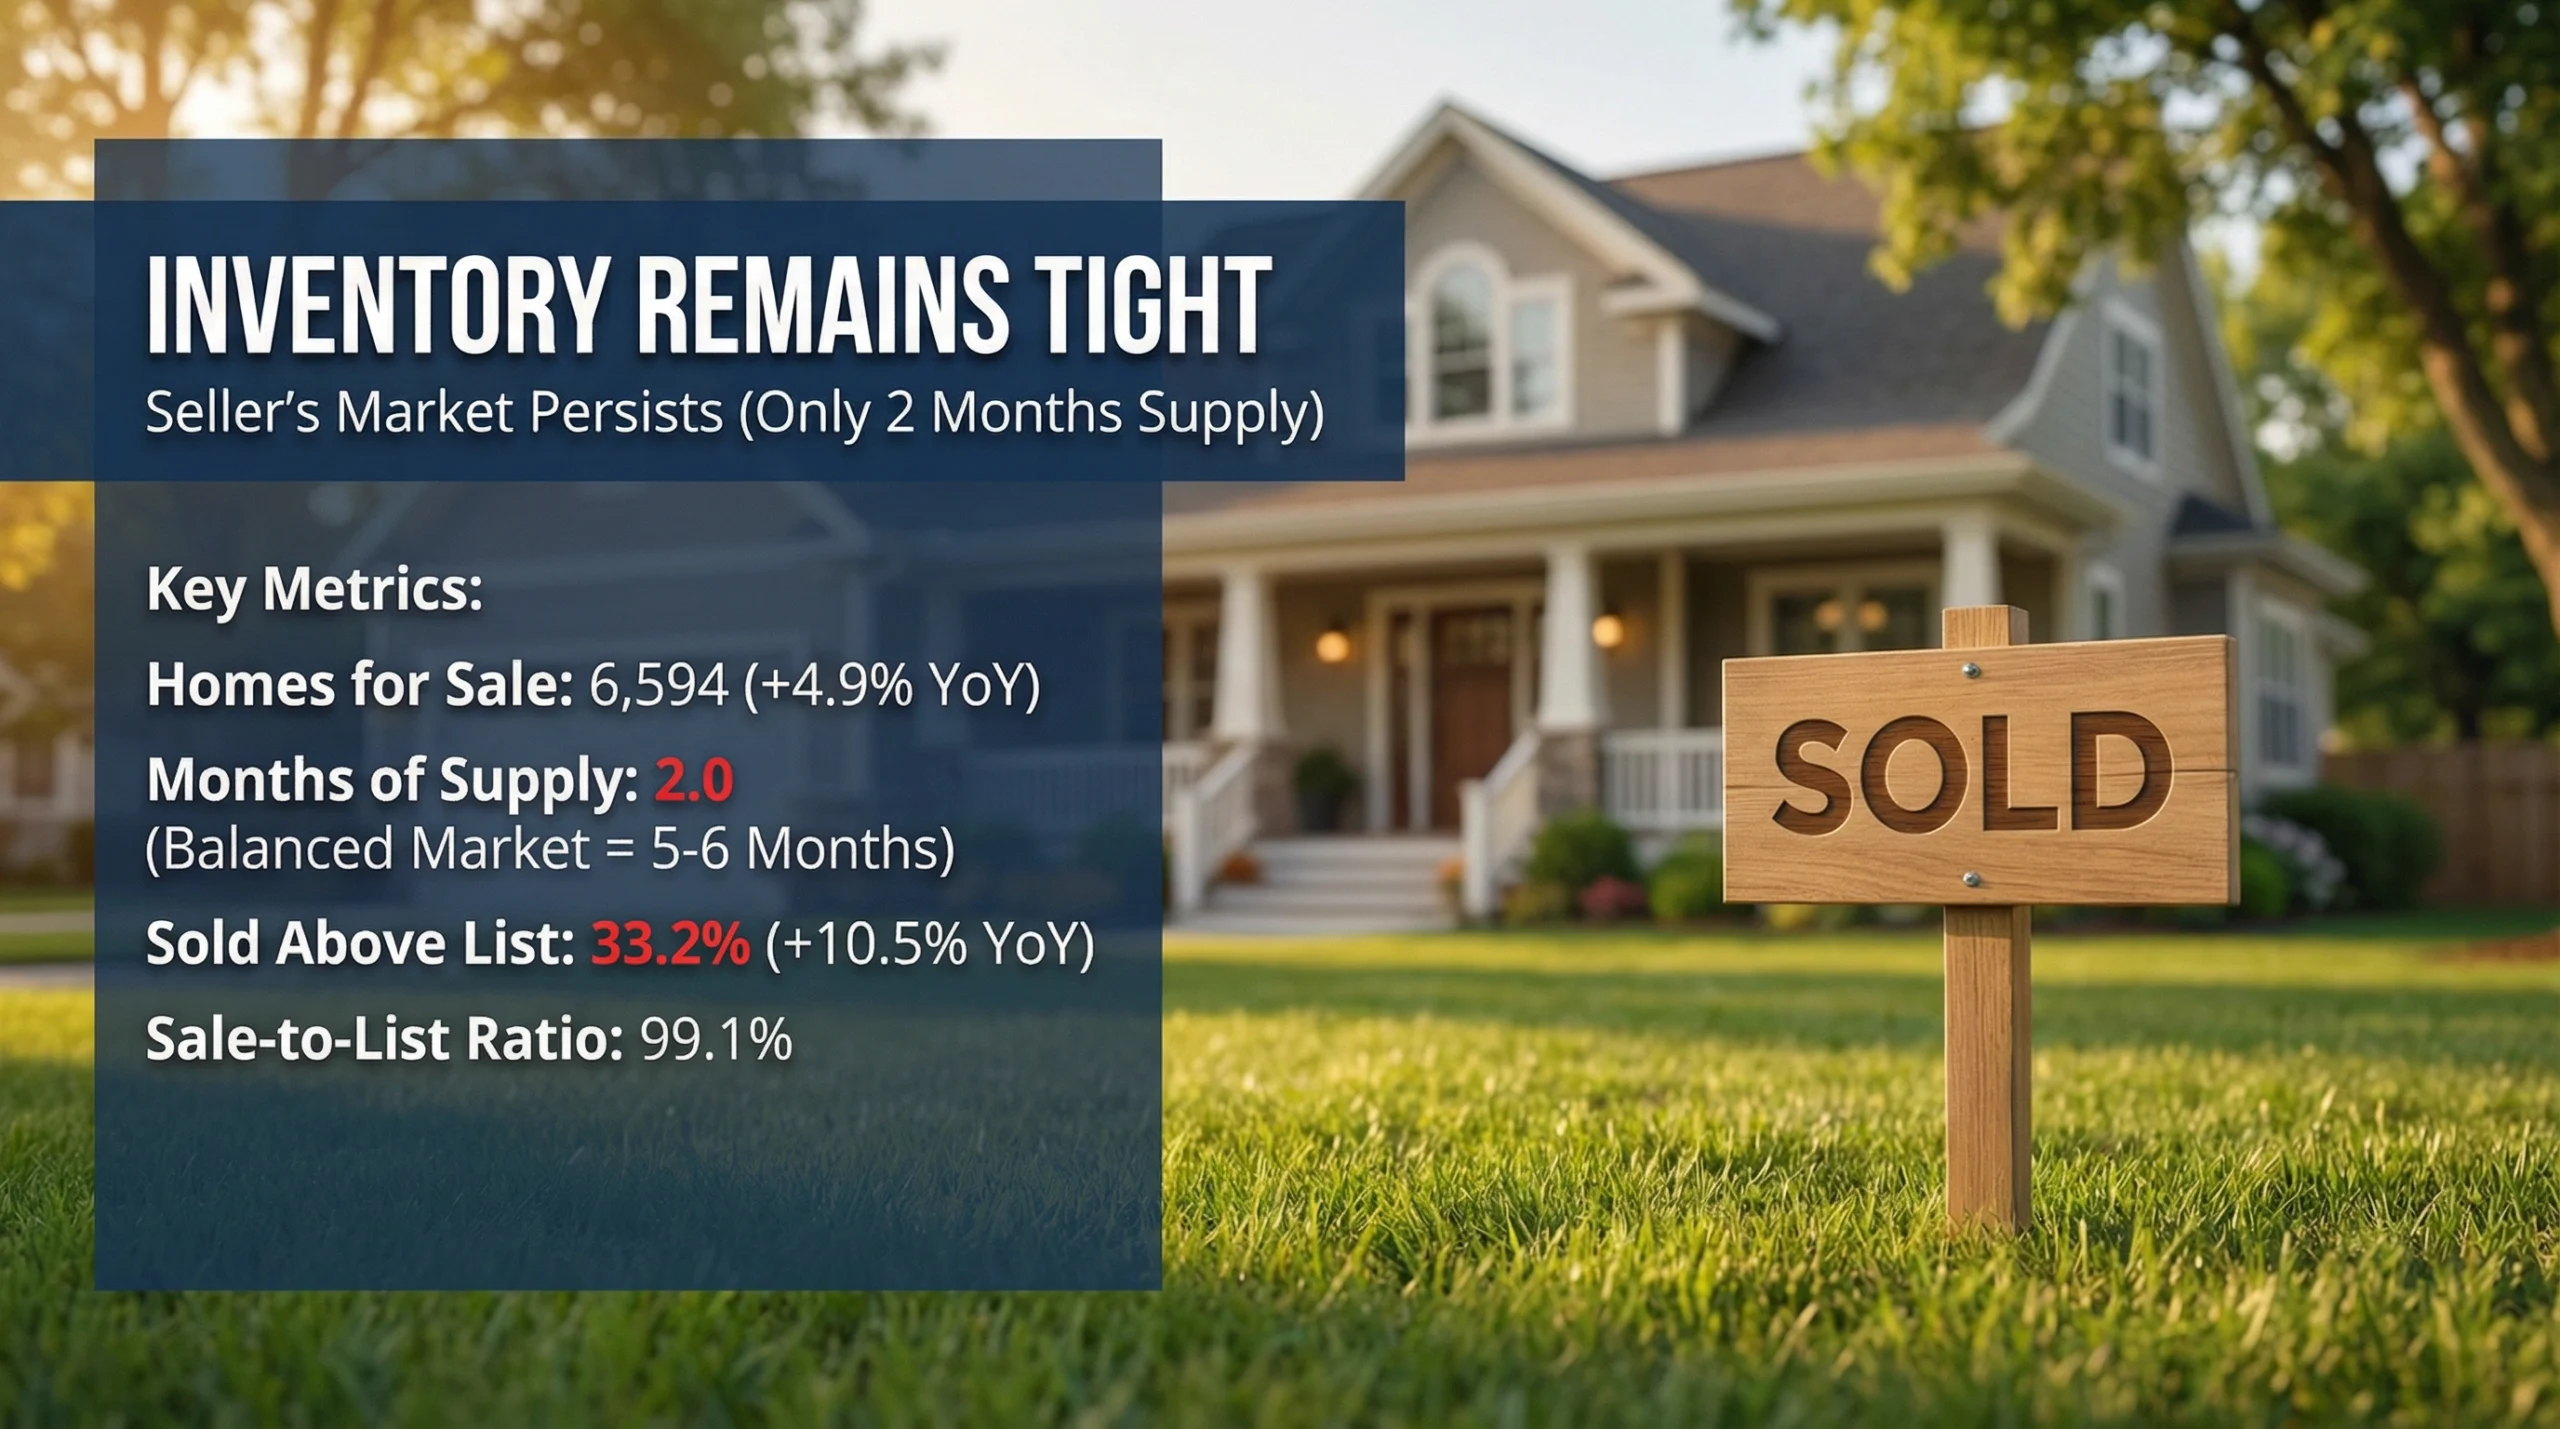
Nebraska remains a seller’s market with just 2 months of housing supply statewide. This tight inventory supports price appreciation despite higher mortgage rates.
| Inventory Metric | Nebraska | Trend |
|---|---|---|
| Homes for Sale | 6,594 | +4.9% YoY |
| New Listings | 2,139/month | +1.9% YoY |
| Months of Supply | 2.0 | Unchanged |
| Homes Sold Above List | 33.2% | +10.5 points YoY |
| Sale-to-List Ratio | 99.1% | +0.5 points YoY |
Houzeo reports inventory grew 14.1% year-over-year to 4,714 homes in January 2025. New listings surged 22.5%. Yet the market has just 2 months of inventory. This is well below the 5-6 months considered balanced.
The 33.2% of homes selling above list price is a big jump. It increased 10.5 percentage points from the prior year. Bidding wars are common for well-priced properties in good neighborhoods.
What Are Nebraska Rent Prices in 2026?
Nebraska rent prices are well below national averages. This makes the state attractive for renters saving to buy.
| Unit Type | Nebraska Avg | National Avg | Difference |
|---|---|---|---|
| Studio | $985 | $1,200 | 18% lower |
| 1-Bedroom | $1,091 | $1,500 | 27% lower |
| 2-Bedroom | $1,358 | $1,800 | 25% lower |
| 3-Bedroom | $1,625 | $2,100 | 23% lower |
Apartments.com data shows the statewide average rent is $1,091 for one-bedroom units. RentCafe reports a higher average of $1,340 when including all unit types. The cheapest cities include Pleasant Dale, West Point, and Auburn.
Rent-to-income ratios are manageable in Nebraska. Using the 30% rule, a household earning the state median of $74,590 could afford rent up to $1,865 monthly. This is well above average prices.
Rent by Major City
| City | Avg Rent (All Units) | 1-BR Average | 2-BR Average |
|---|---|---|---|
| Omaha | $1,308 | $1,159 | $1,465 |
| Lincoln | $1,334 | $1,100 | $1,400 |
| Bellevue | $1,200 | $1,091 | $1,350 |
| Grand Island | $1,000 | $850 | $1,100 |
What Are Mortgage Rates and Affordability Like?
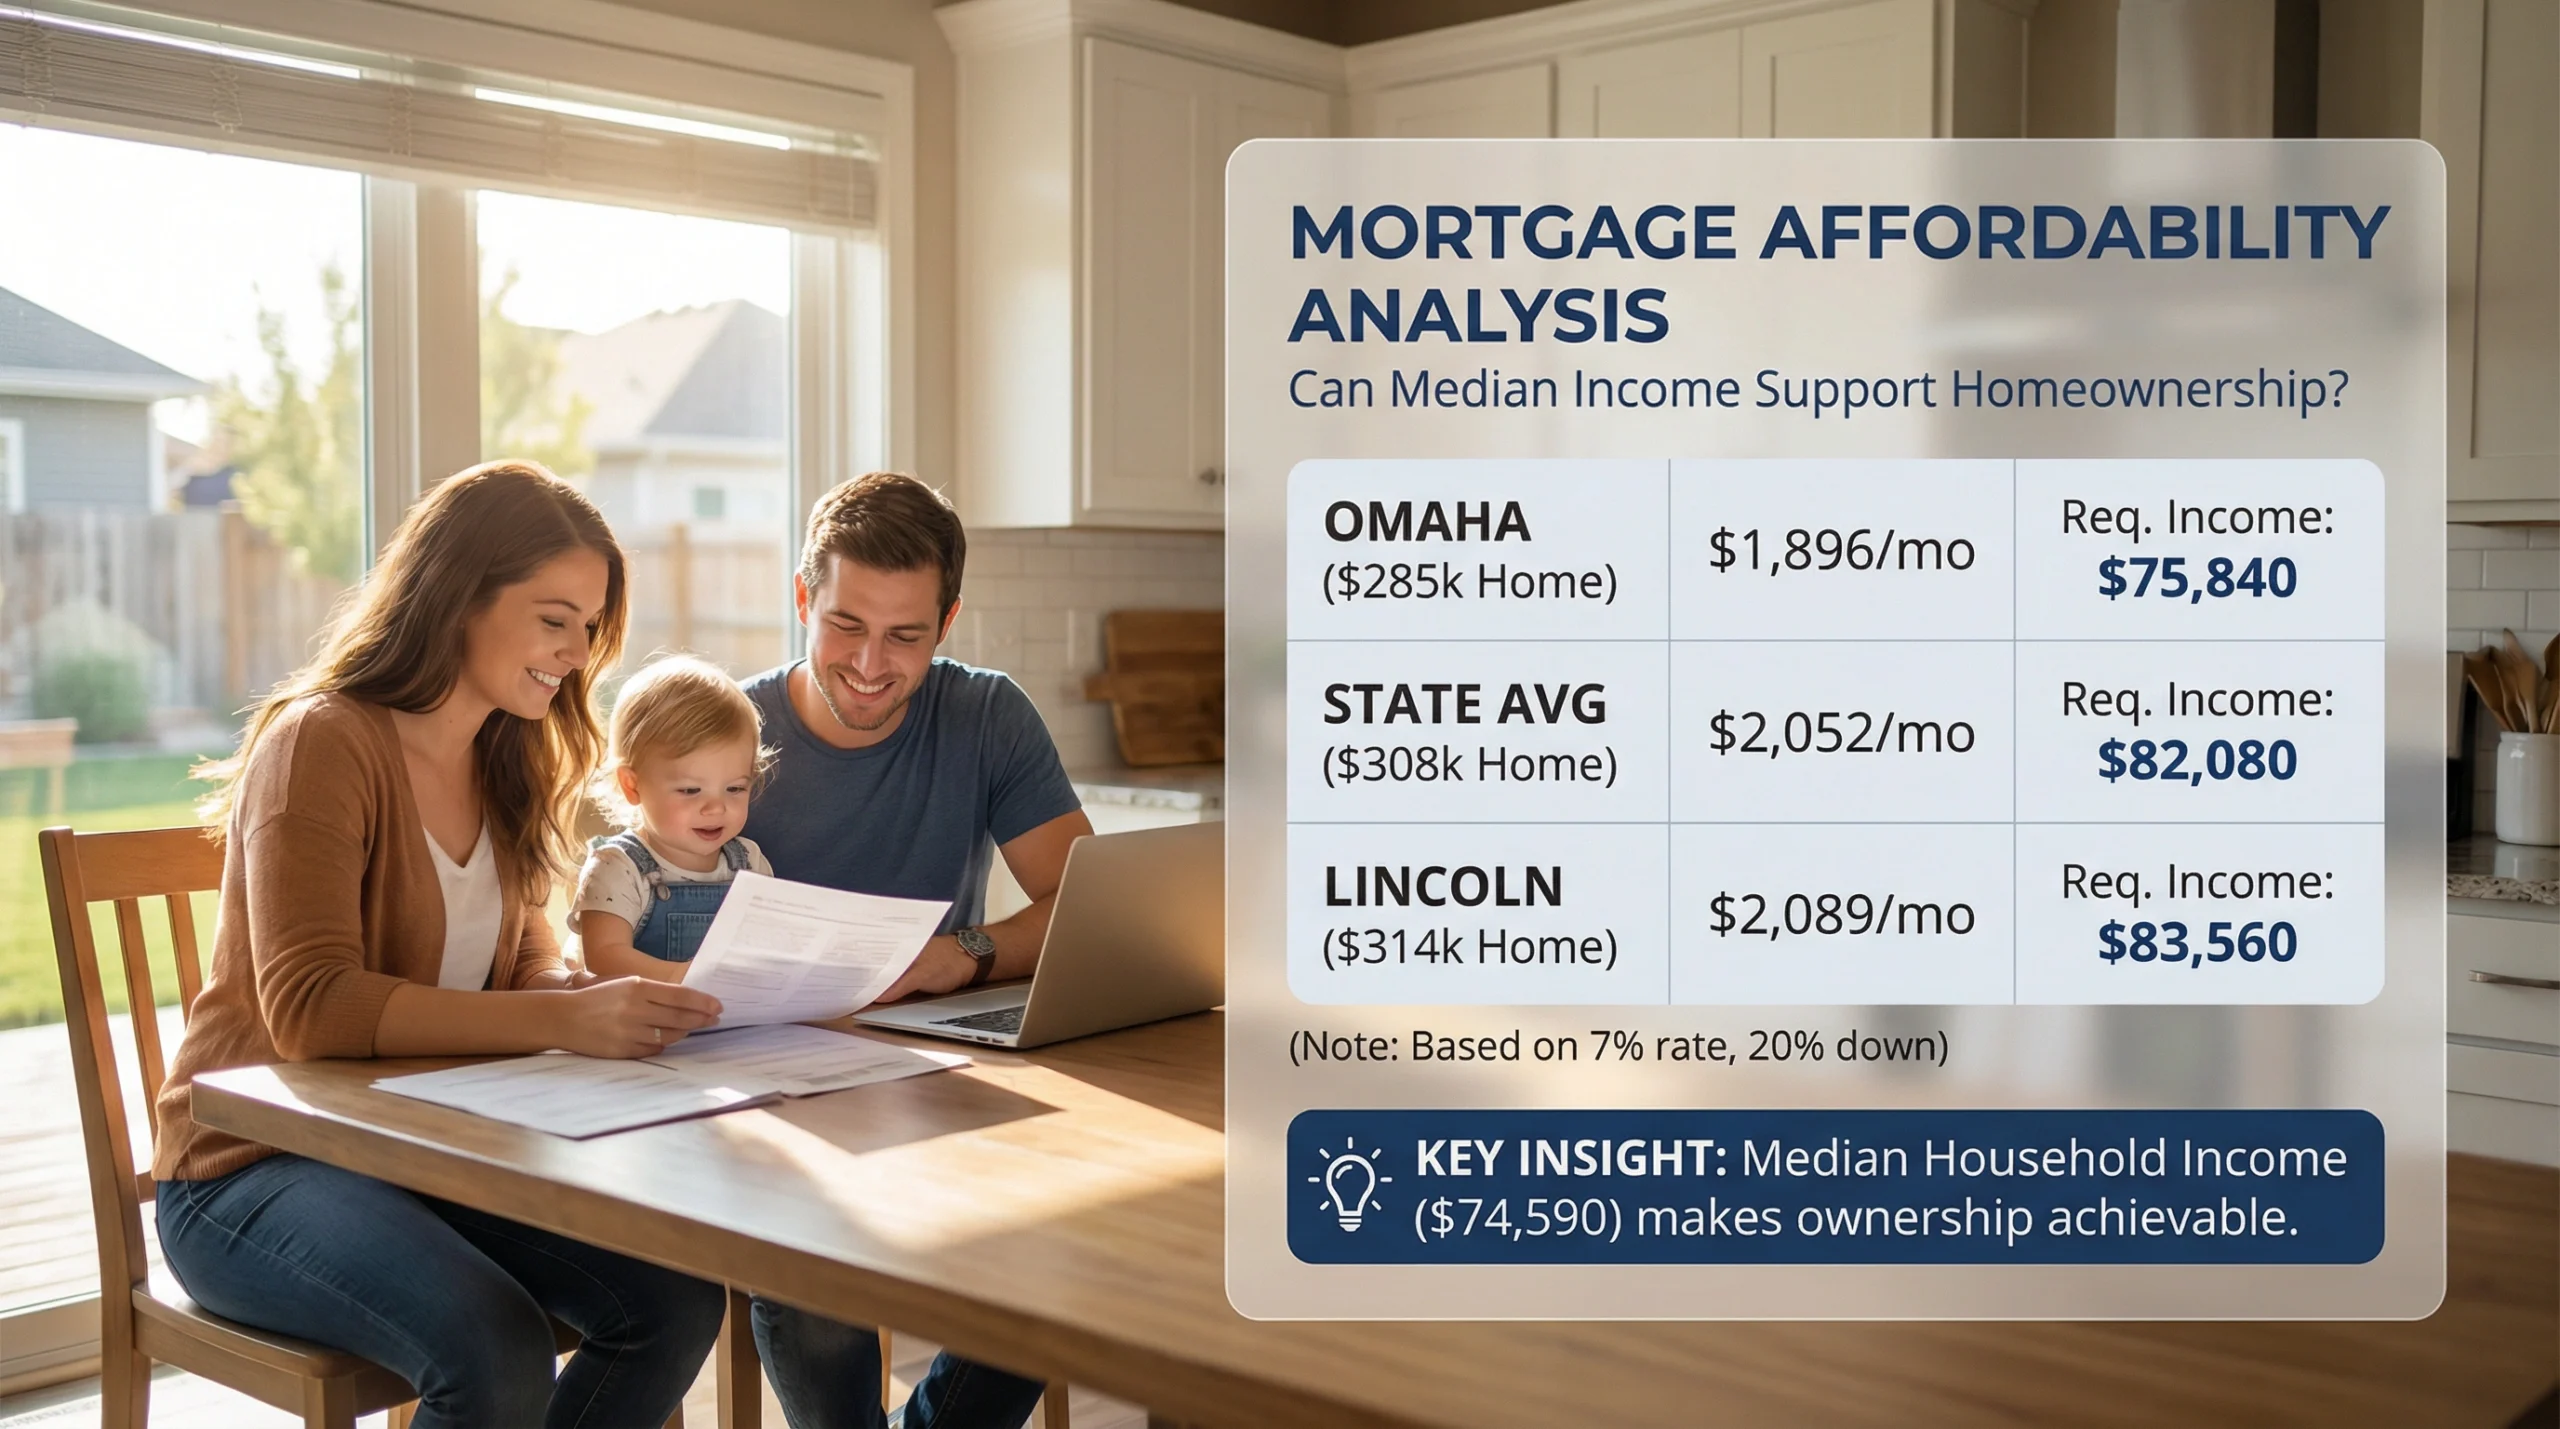
Mortgage rates significantly impact Nebraska’s affordability. Current rates hover near 7% for 30-year fixed loans. Nebraska Realty reports rates at 6.99% as of mid-2025.
| Mortgage Scenario | Monthly Payment | Required Income |
|---|---|---|
| $285,000 home (Omaha median) at 7% | $1,896 | $75,840/year |
| $308,400 home (State median) at 7% | $2,052 | $82,080/year |
| $314,000 home (Lincoln median) at 7% | $2,089 | $83,560/year |
These calculations assume 20% down payment and exclude property taxes and insurance. Adding Nebraska’s 1.63% property tax rate and insurance increases required income by roughly $400-500 monthly.
Nebraska’s median household income of $74,590 can support the Omaha median home price under traditional lending standards. Lincoln’s higher prices push affordability limits for median earners. But the city’s higher local incomes offset this gap.
What Do Experts Forecast for 2026?
Housing forecasters expect Nebraska prices to continue rising moderately through 2026. Tight inventory and stable employment support this outlook.
| Forecast Source | 2026 Price Prediction | Key Factors |
|---|---|---|
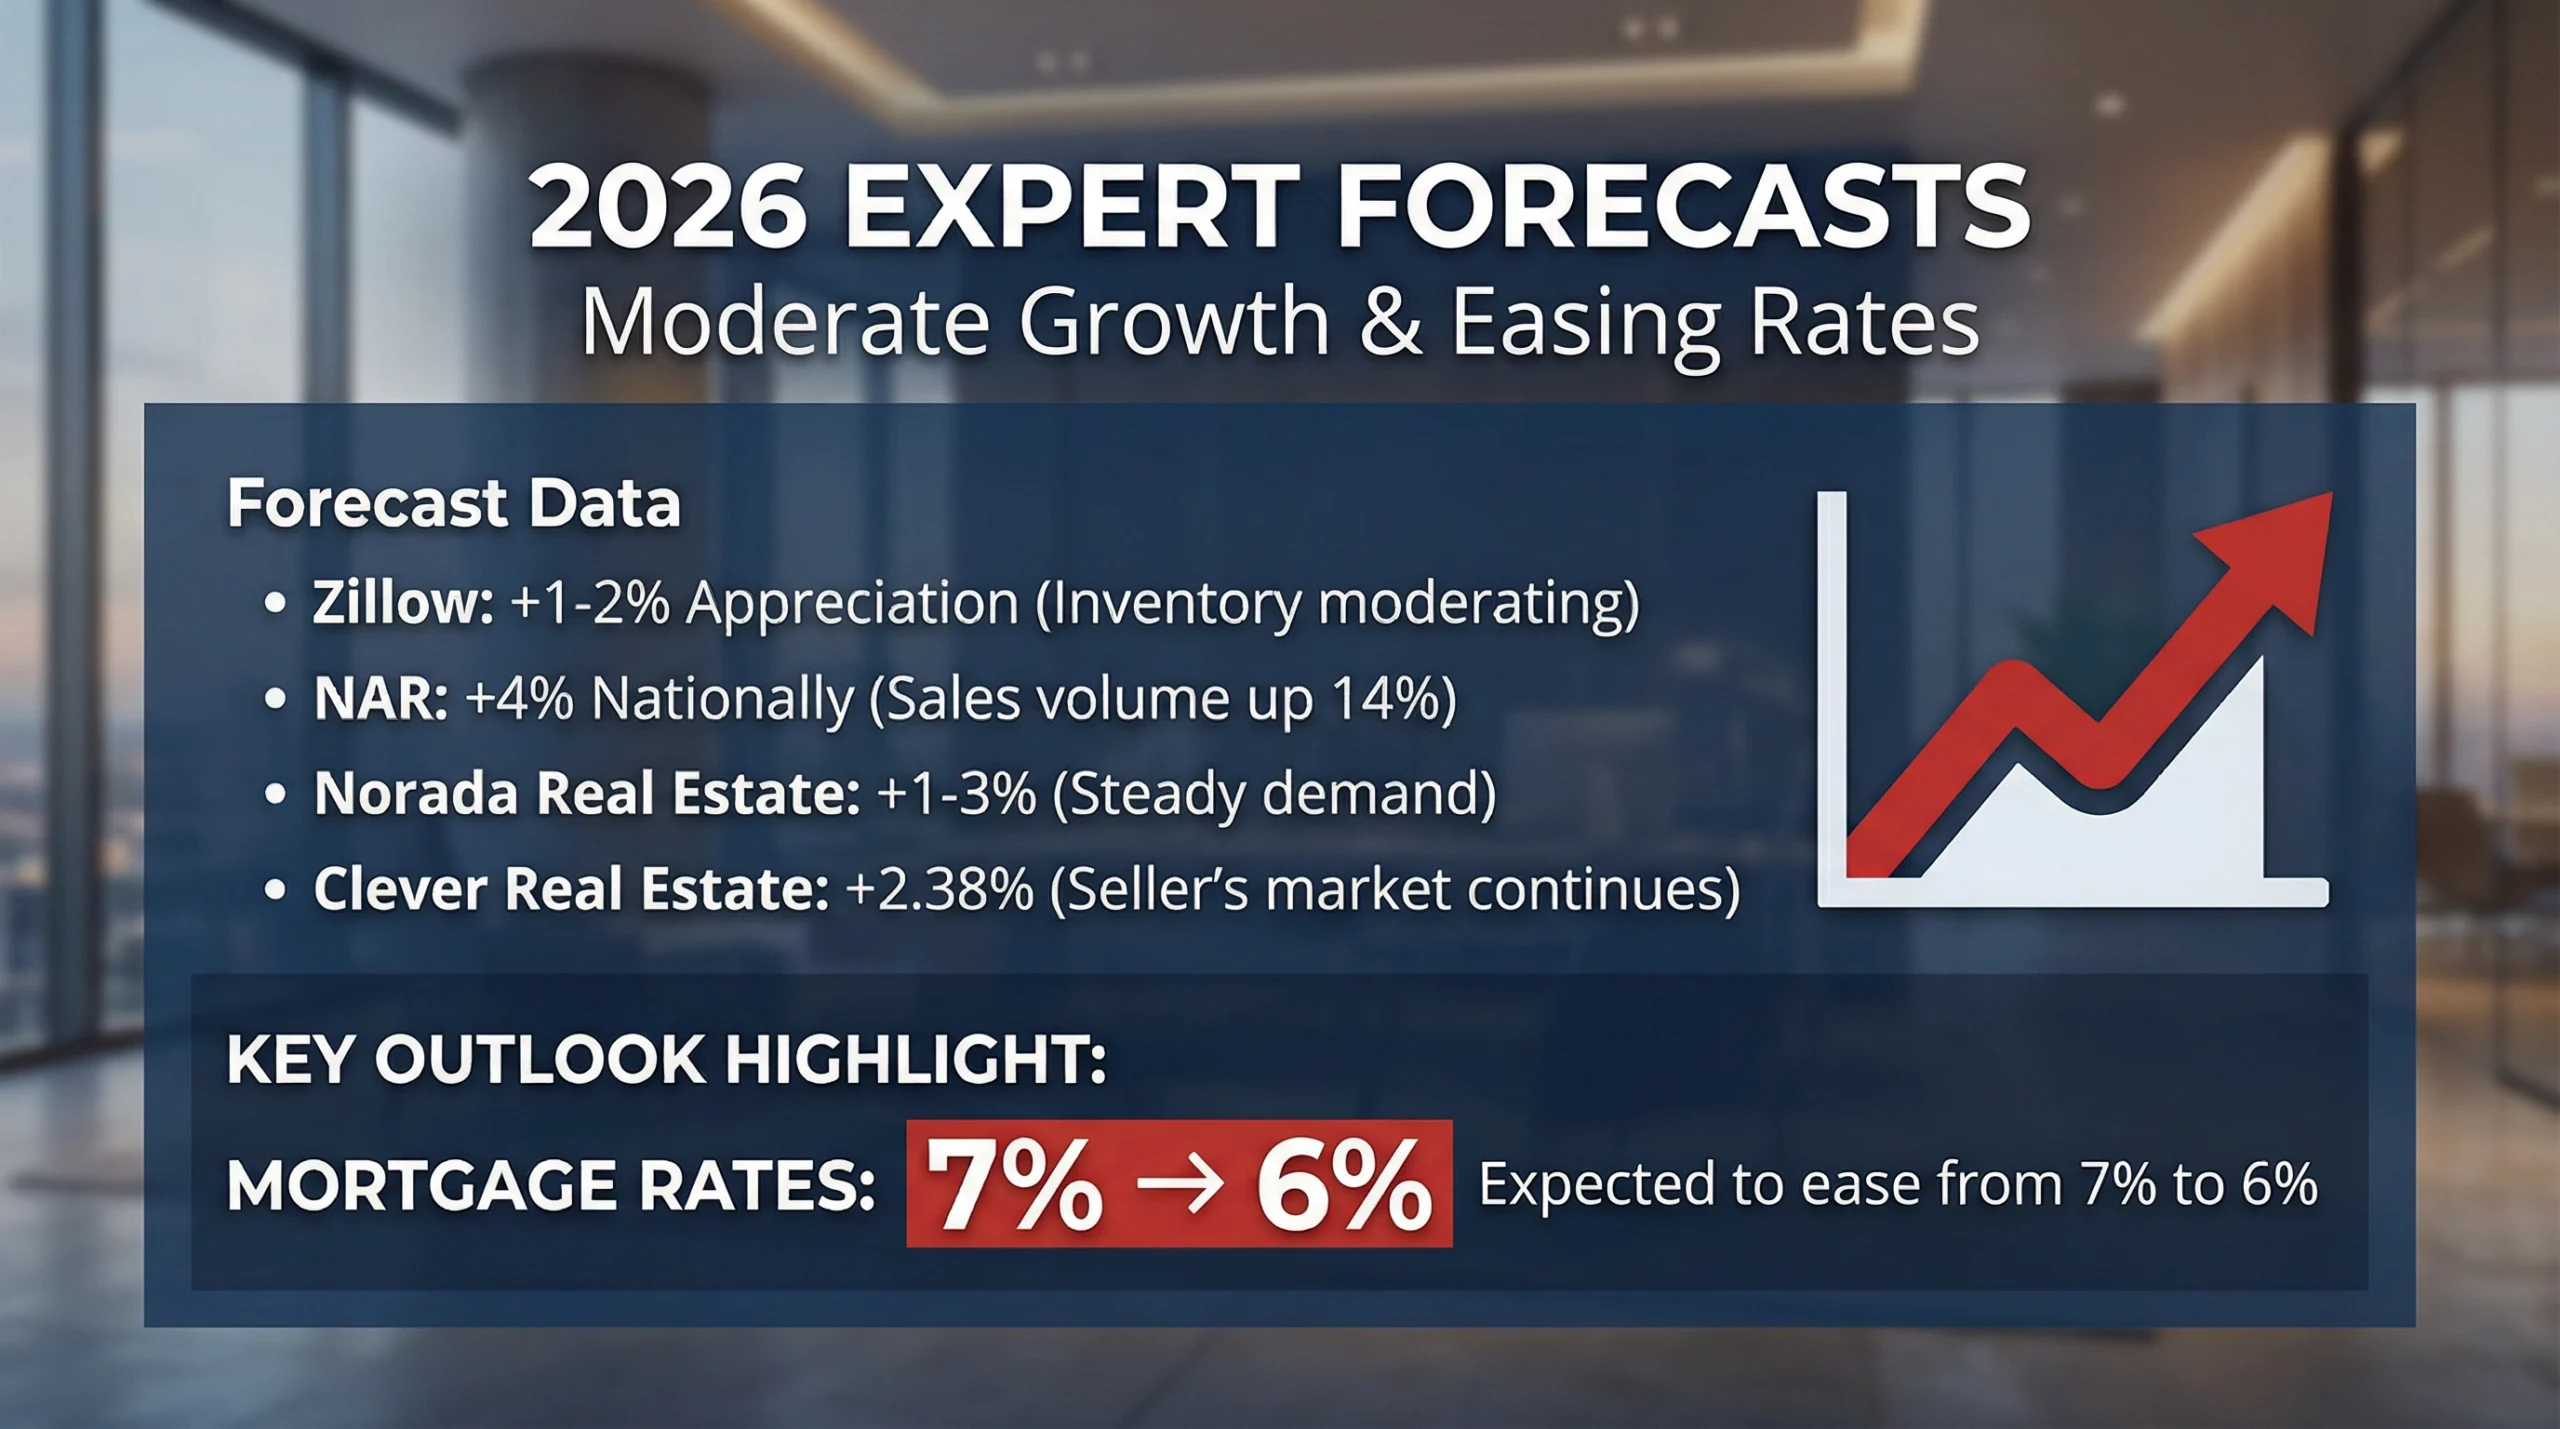
| Zillow | +1-2% appreciation | Inventory growth moderating prices |
| NAR (National) | +4% nationally | 14% sales increase, stable prices |
| Norada Real Estate | +1-3% (Lincoln) | Steady demand, balanced inventory |
| Clever Real Estate | +2.38% statewide | Continued seller’s market |
Norada Real Estate expects Nebraska to see slow and steady growth through 2026. Interest rates remain the key variable. If rates drop toward 6%, buyer activity could surge. If rates stay near 7%, appreciation will slow.
The National Association of Realtors forecasts a 14% nationwide increase in home sales for 2026. They call it “the year we will see a measurable increase in sales.” Mortgage rates are expected to average around 6% in 2026, down from roughly 6.7% in 2025.
Factors Supporting Nebraska’s 2026 Outlook
Several fundamentals support continued Nebraska housing strength:
| Factor | Impact | Outlook |
|---|---|---|
| Inventory | 2 months supply | Remains tight, supporting prices |
| Employment | Strong job market | Berkshire Hathaway, healthcare stable |
| Affordability | 30% below national | Attracts migration from expensive states |
| Population | Slow growth | May limit demand acceleration |
| New Construction | Moderate pace | Not enough to flood market |
Is Nebraska a Buyer’s or Seller’s Market?
Nebraska strongly favors sellers heading into 2026. The 2-month supply of homes, 33% selling above asking, and 22-30 day sale times all benefit sellers.
| Market Indicator | Nebraska Status | What It Means |
|---|---|---|
| Months of Supply | 2.0 | Strong seller’s market (<4 months) |
| Sale-to-List Ratio | 99.1% | Sellers getting near asking price |
| Homes Above List | 33.2% | Bidding wars common |
| Days on Market | 30 | Homes selling quickly |
| Price Drops | 35.7% | Some sellers overpricing initially |
The 35.7% of homes with price drops suggests some sellers are testing high prices before adjusting. Strategic pricing from day one yields faster sales and stronger offers.
What Should Buyers Know About Nebraska in 2026?

Buyers in Nebraska’s market face competition but also opportunity compared to national markets. Here’s what matters for 2026 purchases.
Timing Considerations
Winter months typically have 3-4% lower prices and less competition in Nebraska. Spring and summer bring more inventory but also more buyers. Shop October through February for better negotiating position.
Mortgage Strategy
Rates are expected to ease from 7% toward 6% through 2026. Buyers face a dilemma: buy now at higher rates with less competition, or wait for lower rates with more competition. Many experts suggest buying when you find the right home, then refinancing if rates drop significantly.
Location Value
Secondary markets like Grand Island, Kearney, and smaller Omaha suburbs offer better value than Lincoln or central Omaha. Remote workers particularly benefit from these locations where median prices are $50,000-$100,000 below metro cores.
What Should Sellers Know About Nebraska in 2026?
Sellers have advantage in Nebraska’s tight market, but smart preparation matters more than ever.
Pricing Strategy
Despite the seller’s market, 35.7% of listings see price reductions. Properties priced at market value from day one sell faster and often for more than overpriced listings that sit and cut. Use recent comparable sales within 0.5 miles and the past 90 days for accurate pricing.
Preparation Pays
Homes in move-in condition command premiums. The 38.4% of Omaha homes selling above asking are typically well-maintained. Basic updates to kitchens, bathrooms, and curb appeal deliver strong returns in Nebraska’s market.
Market Timing
Spring remains the strongest selling season. April-June delivers the highest prices and fastest sales. However, the tight inventory means even winter listings attract motivated buyers who have fewer choices.
Historical Price Trends in Nebraska
Nebraska’s housing market has grown steadily over the past decade. It has outperformed many Midwest neighbors while avoiding volatility seen in coastal markets.
| Year | Median Home Price | Annual Change | Key Events |
|---|---|---|---|
| 2019 | $190,000 | +4.2% | Pre-pandemic baseline |
| 2020 | $205,000 | +7.9% | Pandemic demand surge begins |
| 2021 | $235,000 | +14.6% | Peak appreciation, inventory crisis |
| 2022 | $265,000 | +12.8% | Rate hikes begin, prices still rising |
| 2023 | $280,000 | +5.7% | Market normalizing |
| 2024 | $295,000 | +5.4% | Steady appreciation continues |
| 2025 | $308,400 | +4.5% | Moderate growth, tight inventory |
The Federal Reserve’s House Price Index for Nebraska shows continuous growth since 1975, with especially strong gains since 2020. Homes purchased in 2019 have appreciated roughly 60%, providing substantial equity for current owners.
Investment Opportunities in Nebraska Real Estate
Nebraska attracts real estate investors seeking stable returns in an affordable market. Low purchase costs, strong rental demand, and steady appreciation create favorable conditions.
Rental Market Fundamentals
| Investment Metric | Omaha | Lincoln | Grand Island |
|---|---|---|---|
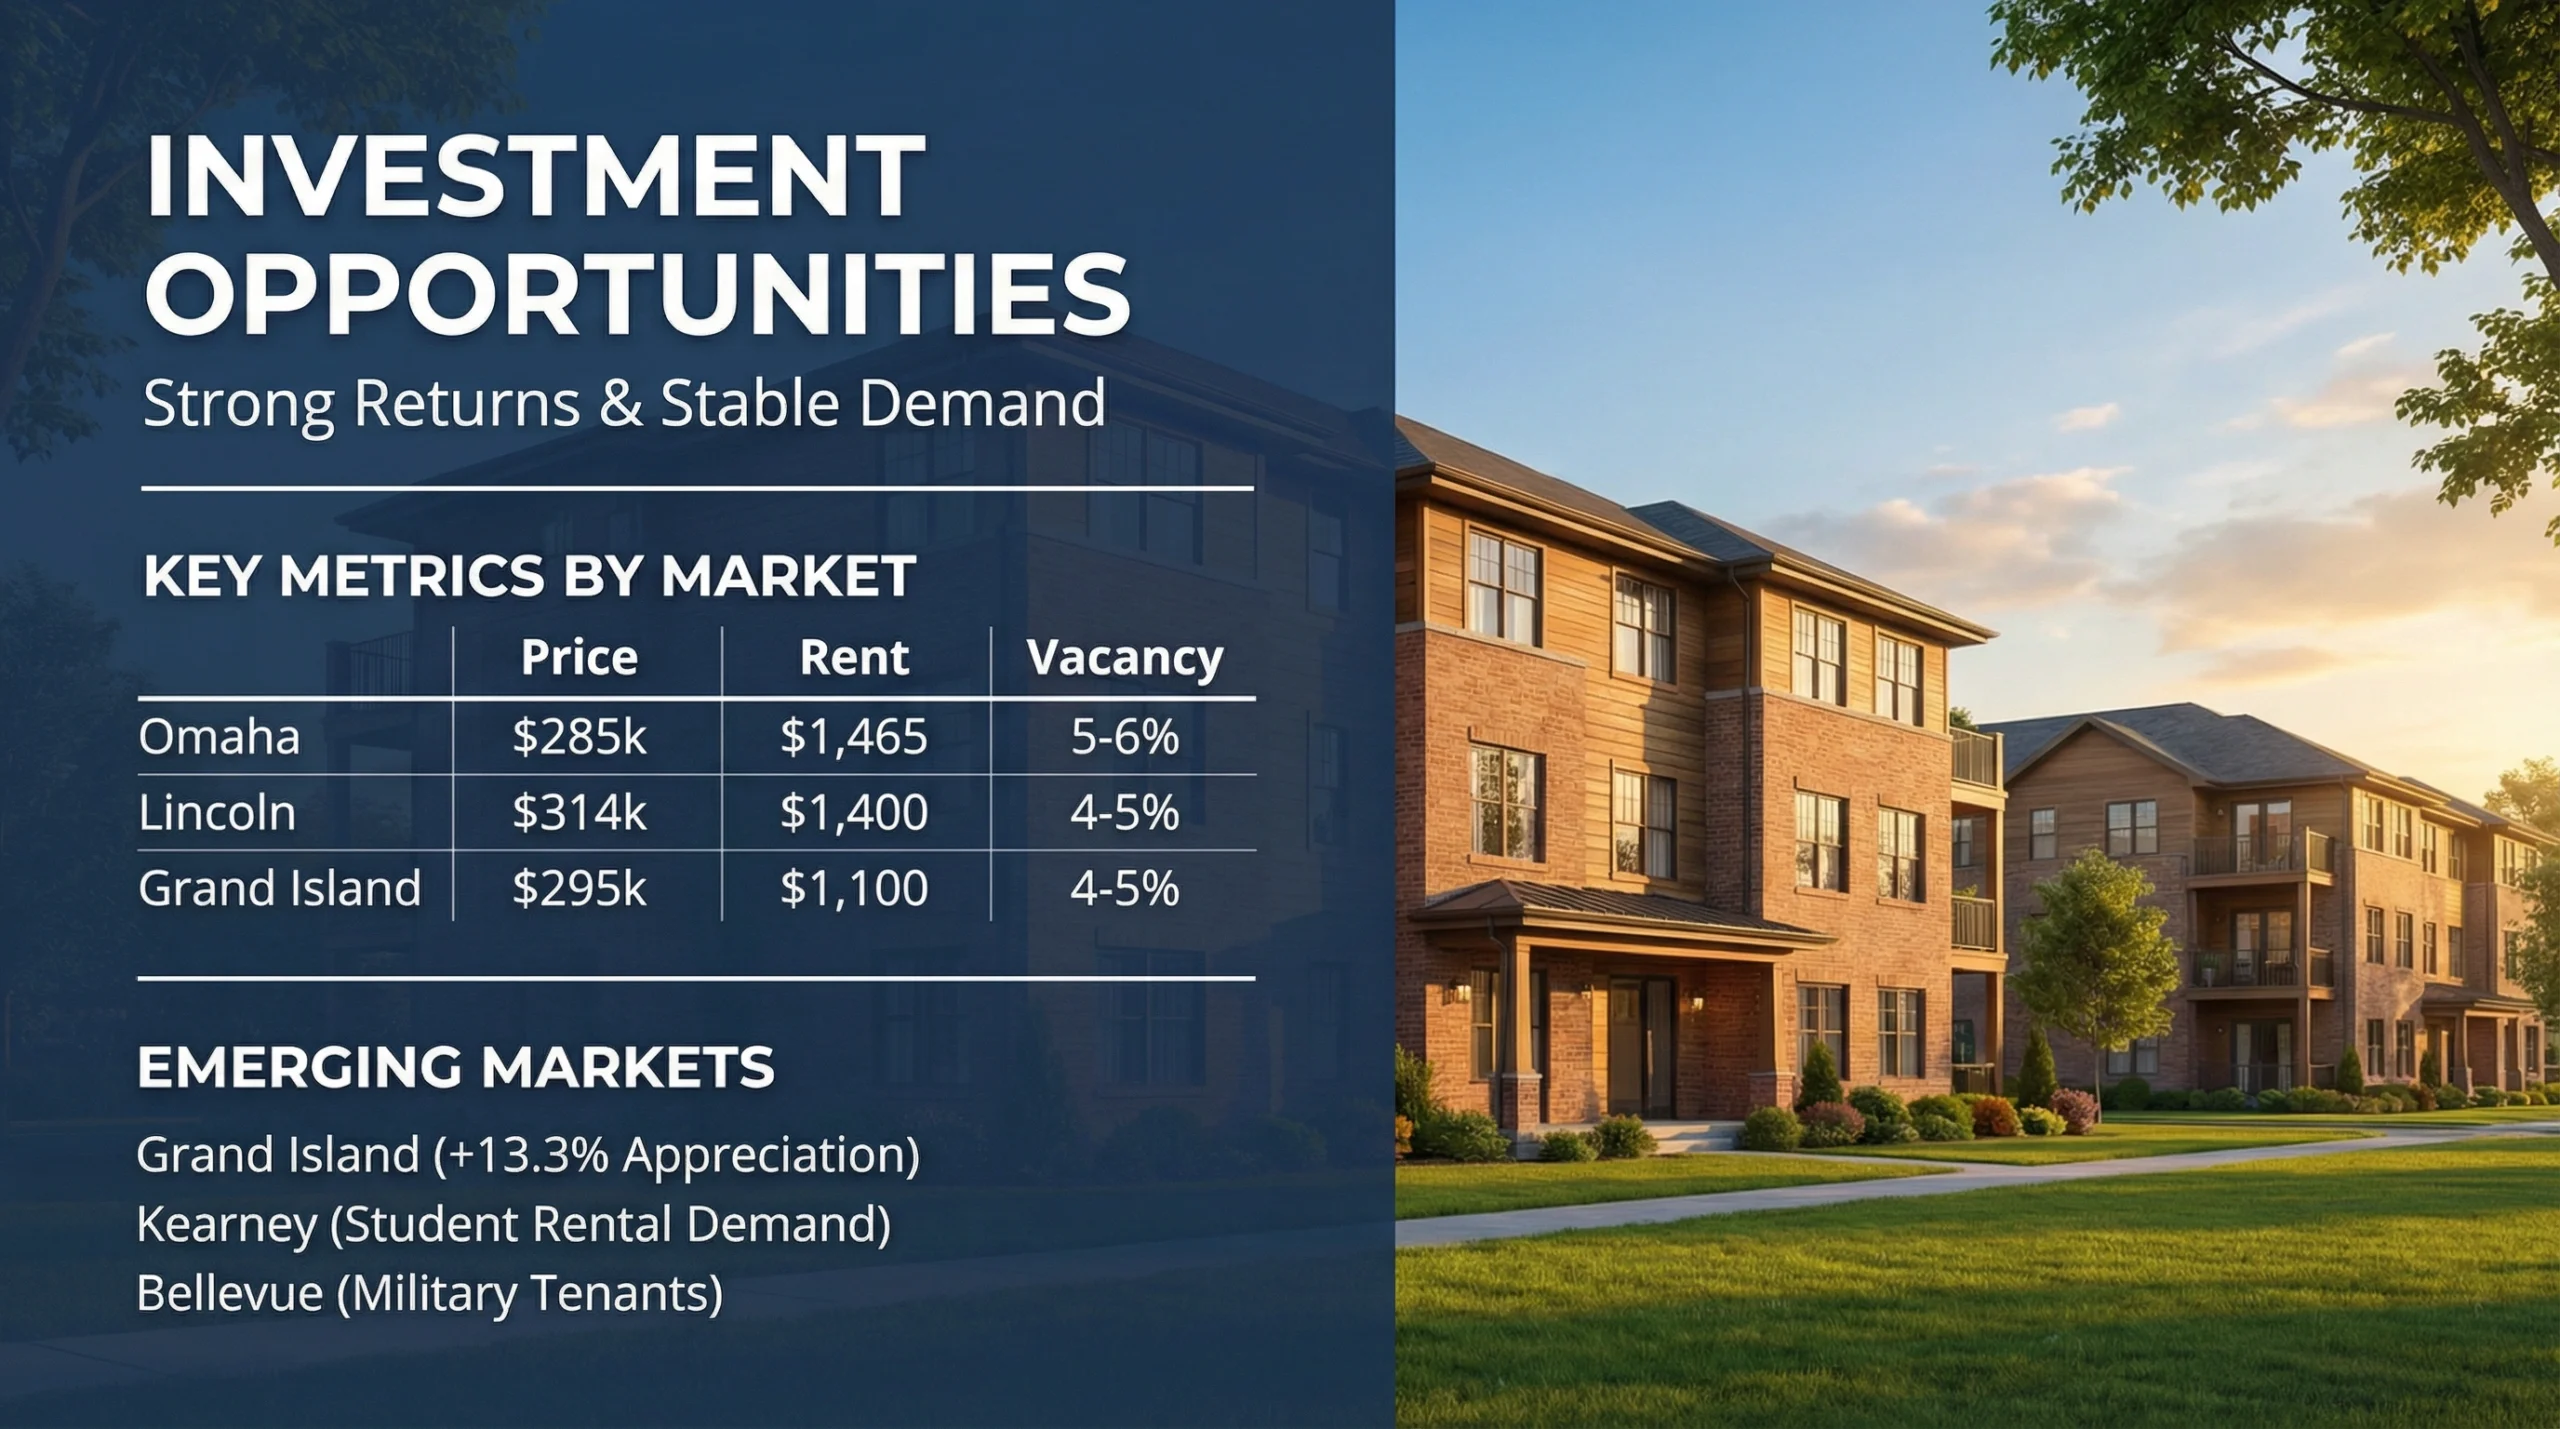
| Median Purchase Price | $285,000 | $314,000 | $295,000 |
| Average Monthly Rent (2BR) | $1,465 | $1,400 | $1,100 |
| Gross Rent Multiplier | 16.2 | 18.7 | 22.3 |
| Rental Vacancy Rate | 5-6% | 4-5% | 4-5% |
| Renter-Occupied Rate | 42% | 44% | 35% |
Omaha has the strongest rental market with 42% of households renting. This creates consistent demand from corporate employers. West Omaha and areas near the University of Nebraska-Lincoln attract multi-family investment. FortuneBuilders reports rental property investors increasingly turn to Nebraska as prices and returns in coastal markets compress.
Emerging Investment Markets
Secondary Nebraska markets offer higher potential returns with greater risk. Grand Island’s 13.3% appreciation shows the upside of smaller markets with improving fundamentals. Kearney benefits from University of Nebraska-Kearney student rental demand. Bellevue’s proximity to Offutt Air Force Base provides stable military tenants.
Nebraska’s Economic Drivers Supporting Housing
Nebraska’s diverse economy supports housing demand through multiple employment sectors.
| Sector | Major Employers | Housing Impact |
|---|---|---|
| Finance/Insurance | Berkshire Hathaway, Mutual of Omaha, First National Bank | High-income buyers, premium neighborhoods |
| Transportation | Union Pacific Railroad, Werner Enterprises | Stable blue-collar housing demand |
| Healthcare | Nebraska Medicine, CHI Health, Bryan Health | Professional housing, medical districts |
| Education | University of Nebraska system, Lincoln Public Schools | Rental demand, family housing |
| Government | State of Nebraska, Offutt AFB | Stable employment, Lincoln/Bellevue demand |
| Agriculture | Cargill, Tyson Foods, JBS | Rural housing support, food processing towns |
Nebraska’s unemployment rate runs 1-2 percentage points below national averages. The diverse employer base protects against sector-specific downturns that can devastate single-industry housing markets.
Cost of Living Comparison for Relocators
Households moving to Nebraska from expensive markets gain significant purchasing power. The state’s 90.1 cost of living index creates real savings across all expense categories.
| Expense Category | Nebraska | California | New York | Texas |
|---|---|---|---|---|
| Housing Index | 78.4 | 196.0 | 235.0 | 95.0 |
| Median Home Price | $308,400 | $787,000 | $455,000 | $350,000 |
| Average Rent (1BR) | $1,091 | $2,100 | $2,500 | $1,350 |
| State Income Tax | 2.46-5.84% | 1-13.3% | 4-10.9% | 0% |
| Property Tax Rate | 1.63% | 0.71% | 1.4% | 1.74% |
A California household selling a $787,000 home and buying Nebraska’s median at $308,400 frees up nearly $480,000 in equity. Even with higher property taxes, the overall savings are substantial for relocators from high-cost states.
Frequently Asked Questions
Is Nebraska a good place to buy a house in 2026?
Nebraska offers strong value with median prices 30% below national averages and no state inheritance tax. The seller’s market means competition for desirable homes, but affordability makes homeownership possible for median-income households. Grand Island, Kearney, and smaller Omaha suburbs offer the best value.
Will Nebraska home prices drop in 2026?
A price drop is unlikely given 2-month inventory supply and sustained demand. Forecasters project 1-4% appreciation statewide. Individual markets like Bellevue may see flat prices, but broad declines are not expected without economic disruption or inventory surge.
What salary do you need to buy a home in Nebraska?
For the statewide median home price of $308,400 at 7% interest with 20% down, buyers need roughly $82,000 annual income. In Omaha ($285,000 median), the threshold drops to about $76,000. Nebraska’s median household income of $74,590 makes homeownership achievable for many families.
How does Nebraska compare to neighboring states?
Nebraska’s median home price of $308,400 compares favorably to Colorado ($550,000+) but runs higher than Kansas ($240,000) and Iowa ($220,000). Nebraska offers stronger job markets and higher incomes than most regional neighbors, supporting housing demand.
What are the cheapest cities in Nebraska to buy?
Alliance and Beatrice offer median home prices well below the state average of $277,400. Scottsbluff and other rural western Nebraska communities also have affordable options, though with limited job markets. In the Omaha metro, North Omaha neighborhoods like Benson offer entry points under $200,000.
Is rent-to-own a good option in Nebraska?
Nebraska’s affordable prices make traditional mortgages preferable when possible. Rent-to-own arrangements often cost more overall and have less consumer protection. With median rent at $1,091 and median home prices at $308,400, saving for a conventional down payment is achievable within 2-3 years for many households.
What’s the property tax rate in Nebraska?
Nebraska’s effective property tax rate of 1.63% ranks among the higher rates nationally. On a $308,400 home, expect roughly $5,027 annually in property taxes. However, the state has no inheritance tax and relatively low income taxes, which partially offset property tax costs.
How long does it take to sell a house in Nebraska?
Homes sell in an average of 30 days statewide, with Omaha and Lincoln averaging 22-23 days. Well-priced homes in desirable areas often go pending within 14 days. The 33.2% of homes selling above asking suggests strong buyer demand for quality properties.