

Connecticut is now one of the busiest places to buy a home. Hartford is the hottest city in the whole country as of mid-2025. Prices keep going up, few homes are for sale, and many towns see lots of bidding fights. If you plan to buy, sell, or invest here, you need to know what is happening.

What Is the Median Home Price in Connecticut?
In 2026, a normal Connecticut home sold for $449,100, says Redfin. That is 8% more than one year ago. Other sites show slightly different numbers, Houzeo saw $415,300 in January, and Zillow puts the average near $377,247, but every source agrees: prices are moving up fast. There are not enough houses on the market, so buyers often compete with several offers on the same day. Most homes sell within a month, and many go for more than the asking price. Because supply is tight and people keep moving in from New York and Boston, experts expect prices to rise further through 2026.
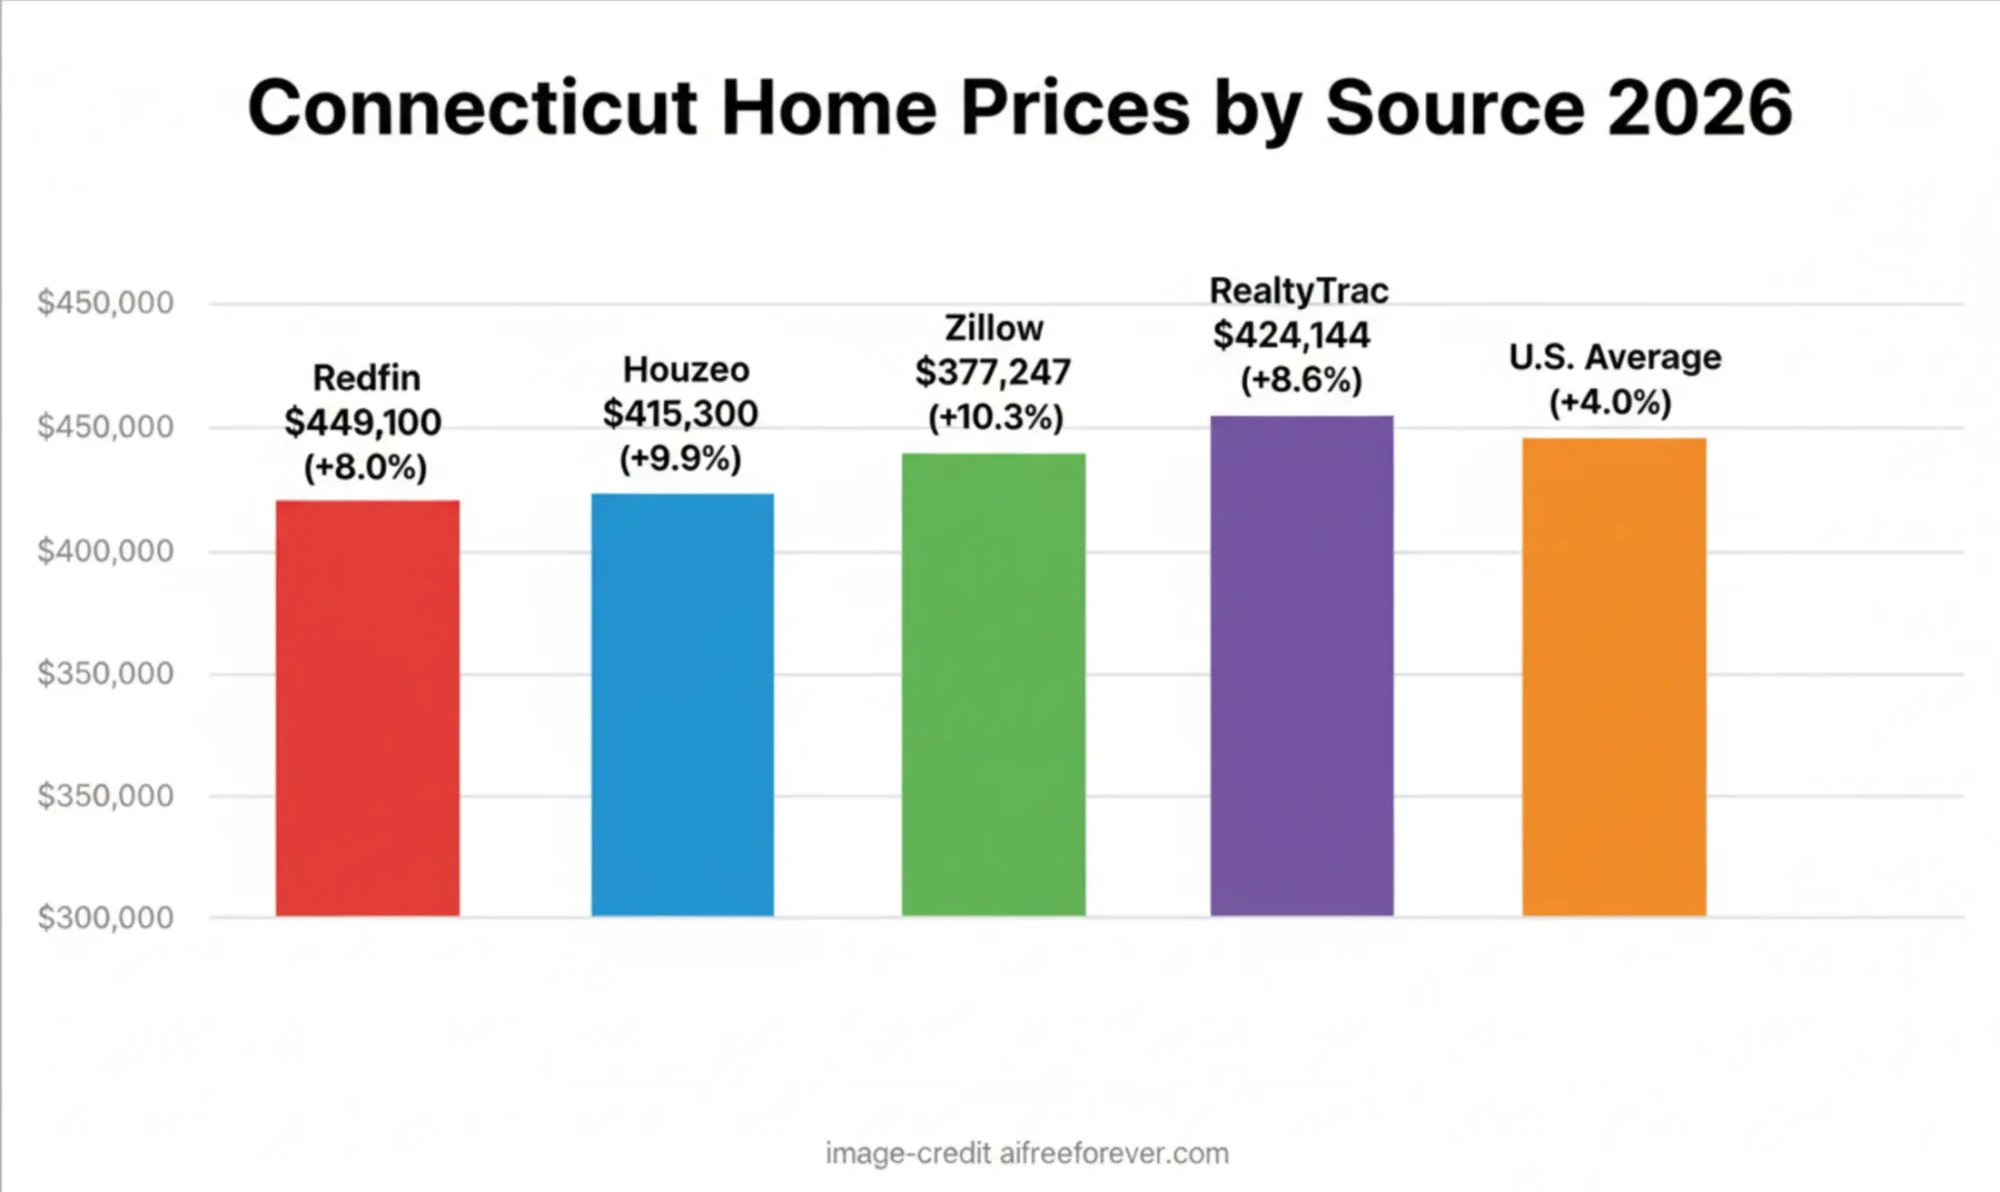
| Data Source | Median/Average Home Price | Year-over-Year Change | Report Date |
|---|---|---|---|
| Redfin | $449,100 | +8.0% | October 2025 |
| Houzeo | $415,300 | +9.9% | January 2025 |
| Zillow (Home Value Index) | $377,247 | +10.3% | 2025 |
| RealtyTrac | $424,144 | +8.6% | 2025 |
| National Average (comparison) | $420,000 | +4.0% | 2025 |

How Does the Connecticut Real Estate Market Compare Nationally?
Connecticut keeps beating most other states on home-price gains. CT Mirror reports that prices here rose 8.15% in the past year and have jumped 67% since five years ago, good for fourth place in the nation.
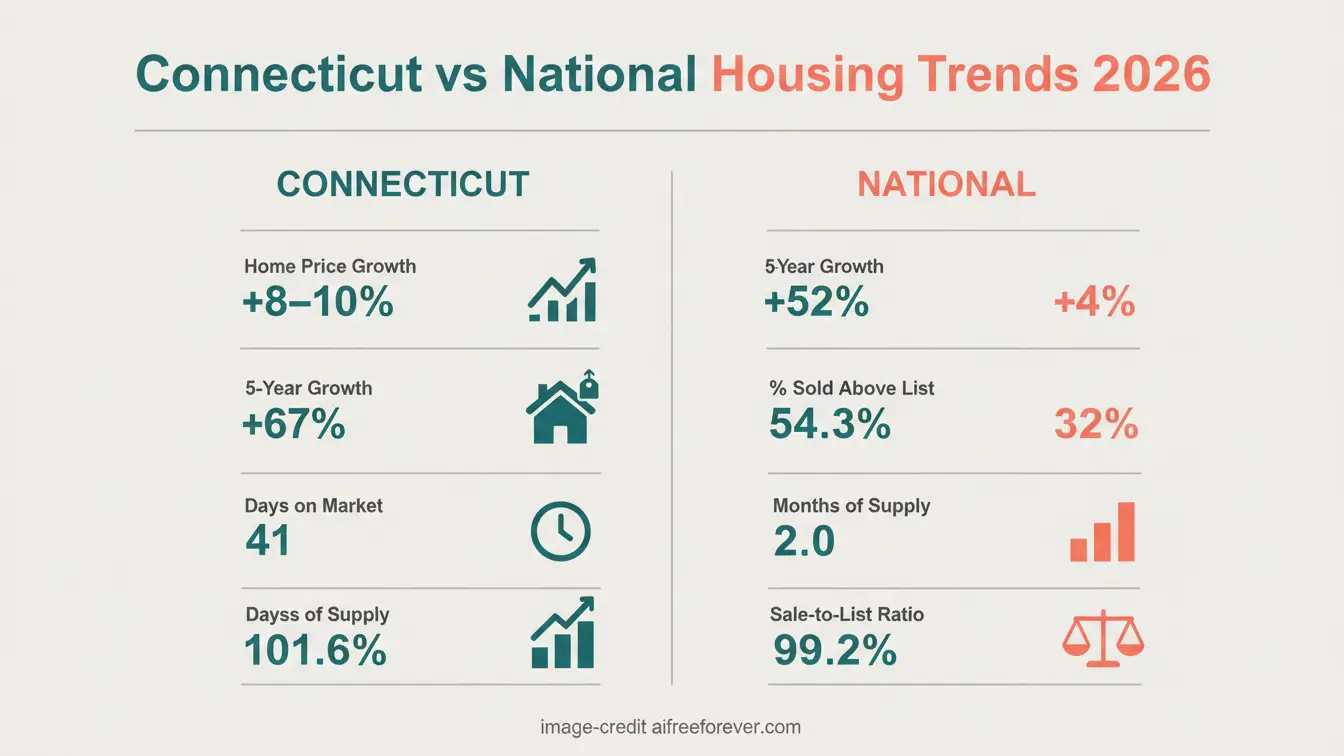
The National Association of Realtors put the Hartford-East Hartford-Middletown area on its 2025 top-ten hot list, pointing to cheaper homes than nearby metros, local loan rates near 6.5% (below the 7% national mark), more new jobs, and plenty of first-time buyers. By June, ConsumerAffairs named Hartford the single hottest city in the country; Bridgeport and New Haven also landed in the national top ten.
| Market Metric | Connecticut | National Average | CT vs National |
|---|---|---|---|
| Home Price Growth (YoY) | +8.0% to +9.9% | +4.0% | Nearly double national rate |
| 5-Year Price Growth | +67.28% | +52% | +15 percentage points |
| Homes Sold Above List Price | 54.3% | 32% | +22 percentage points |
| Median Days on Market | 41 days | 52 days | 11 days faster |
| Months of Supply | 2 months | 3.8 months | Much tighter inventory |
| Sale-to-List Price Ratio | 101.6% | 99.2% | Stronger seller position |
What Are Connecticut Home Prices by Region?
Prices change a lot depending on where you look. Fairfield County, close to New York City, costs the most. Zillow Research says a typical home in the Bridgeport-Stamford-Norwalk area runs about $568,000—far above the national mark. Hartford and New Haven stay cheaper, giving buyers lower-cost choices while still within reach of big-city jobs.
| Metro Area/Region | Typical Home Value | YoY Price Change | Median Days on Market | Market Characteristics |
|---|---|---|---|---|
| Bridgeport-Stamford-Norwalk (Fairfield County) | $568,000 | +7.9% | 35 days | Highest prices, NYC commuters |
| Hartford-East Hartford-Middletown | $320,000-$350,000 | +6.7% | 6 days | #1 hottest market in U.S. |
| New Haven-Milford | $370,507 | +8.8% | 38 days | Strong college town demand |
| Norwich-New London | $320,000 | +3.2% | 45 days | Coastal, military presence |
| Torrington | $280,000 | +3.9% | 50 days | Affordable, rural appeal |
| Danbury | $475,000 | +7.5% | 30 days | Competitive, NYC accessible |
Average House Price in Connecticut by County
Connecticut’s eight counties each offer distinct housing markets with varying price points and market dynamics:
| County | Average Home Price | Market Type | Key Towns/Cities |
|---|---|---|---|
| Fairfield County | $568,000+ | Premium/Luxury | Stamford, Greenwich, Norwalk, Westport |
| Hartford County | $320,000 | Affordable Urban | Hartford, West Hartford, Glastonbury |
| New Haven County | $370,507 | Mixed Urban/Suburban | New Haven, Milford, Hamden |
| Middlesex County | $385,000 | Suburban | Middletown, Old Saybrook |
| New London County | $340,000 | Coastal/Military | New London, Norwich, Groton |
| Litchfield County | $375,000 | Rural/Second Homes | Torrington, Litchfield |
| Tolland County | $350,000 | Suburban | Vernon, Tolland |
| Windham County | $285,000 | Most Affordable | Willimantic, Putnam |
What Is the Connecticut Housing Market Inventory Situation?
Connecticut’s housing market continues to face a severe inventory shortage that drives competition and sustains price growth. According to Redfin, there were 11,534 homes for sale in Connecticut in October 2025, representing a modest 1.6% year-over-year increase. However, with only 2 months of supply available, the market remains firmly tilted toward sellers.
Houzeo reported even tighter conditions earlier in 2025, with inventory down 13.8% year-over-year and new listings falling 12.7%. This persistent supply constraint has created intense competition, with over half of Connecticut homes selling above their asking price.
| Inventory Metric | Current Value | Year-over-Year Change | Impact |
|---|---|---|---|
| Total Homes for Sale | 11,534 | +1.6% | Slight improvement |
| New Listings | 3,794/month | -0.11% | Essentially flat |
| Months of Supply | 2 months | Down YoY | Strong seller’s market |
| Homes Sold Above List Price | 54.3% | +0.6 points | Increasing competition |
| Homes with Price Drops | 23.9% | +3.9 points | Some softening |
| Sale-to-List Price Ratio | 101.6% | -0.12 points | Buyers paying above asking |
| Median Days on Market | 41 days | +1 day | Still fast sales |
Why Is Hartford the Hottest Housing Market in America?
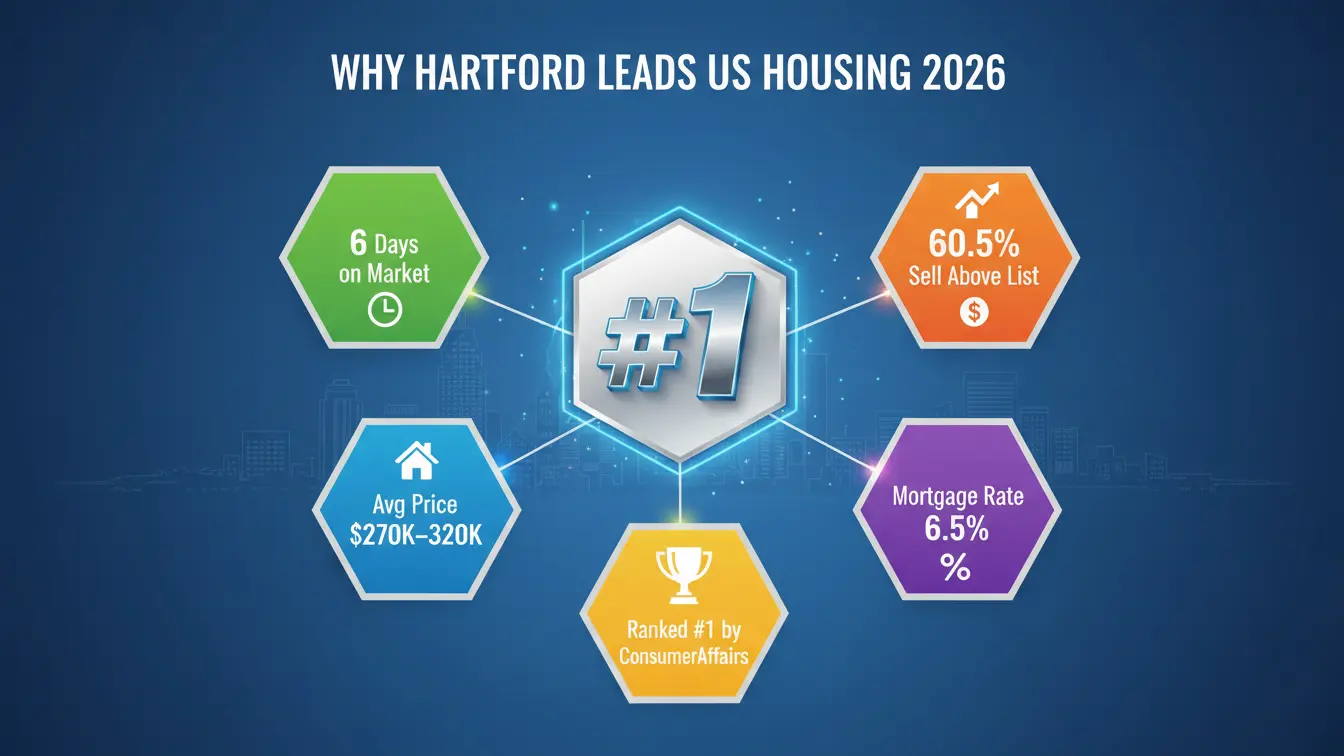
Hartford is at the top of the 2025 heat list because homes here are still cheaper than in Boston or New York, yet there are very few for sale. ConsumerAffairs puts the city in first place out of 200 towns, and the numbers show why:
– A listing goes “sale pending” in only six days, the third-fastest mark in the study.
– Six out of every ten homes fetch more than the posted price; fewer than three in ten sell below it.
– Local loan rates sit near 6.5%, under the 7% national figure, so buyers keep pouring in.
The National Association of Realtors adds that many long-term owners in the region are ready to list, giving hope for more supply, but for now the tight stock keeps the market burning hot.
| Hartford Market Metric | Value | National Rank |
|---|---|---|
| Overall Market Heat | #1 | Hottest in U.S. |
| Median Days on Market | 6 days | #3 fastest |
| Homes Sold Above List Price | 60.5% | #3 highest |
| Homes Sold Below List Price | 29.1% | #3 lowest |
| Average Mortgage Rate | 6.5% | 0.5% below national average |
| Average Home Price | $270,000-$320,000 | Below national median |
What Is the Connecticut Housing Market Forecast for 2026?
Expert forecasts for the Connecticut housing market in 2026 point toward continued strength with moderating price growth. According to Norada Real Estate, multiple metro areas are expected to see price increases of 3-4% through 2026, with some markets potentially reaching higher appreciation.
| Metro Area | 2025 Forecast | 2026 Forecast | Outlook |
|---|---|---|---|
| Hartford | +3.0% | +3.5% to +4.5% | Strong continued growth |
| New Haven | +3.5% | +4.0% to +4.5% | Urban demand steady |
| Bridgeport-Stamford | +2.0% | +2.5% to +3.5% | Premium market stable |
| Norwich | +3.2% | +3.0% to +3.5% | Modest appreciation |
| Torrington | +3.9% | +3.5% to +4.0% | Affordability drives demand |
| Statewide Average | +3.0% to +4.0% | +3.5% to +4.5% | Slower but steady growth |
Is Connecticut a Buyer’s or Seller’s Market in 2026?
Connecticut remains firmly a seller’s market heading into 2026. With just 2 months of housing supply (compared to the 6-month equilibrium benchmark), sellers maintain significant negotiating power. According to Houzeo, over 46% of homes continue to sell above list price, and the sale-to-list price ratio exceeds 100%, indicating buyers typically pay more than asking prices.
| Market Indicator | Current Status | What It Means |
|---|---|---|
| Months of Supply | 2 months | Strong seller’s market (6 months = balanced) |
| Sale-to-List Ratio | 101.6% | Buyers paying above asking |
| Homes Above List | 54.3% | Majority sell over asking price |
| Days on Market | 41 days (6 days Hartford) | Fast sales benefit sellers |
| Price Drops | 23.9% | Some negotiation room emerging |
| New Listings Trend | Flat to declining | Limited seller activity continues |
Advice for Buyers
In this fast moving real estate market, get your loan pre-approved before you even look. When a nice house pops up, see it the same day and be ready to bid. In hot towns like Hartford you may need to offer more than the tag says. If you can live farther out, check Windham County or Torrington for lower tags. Use an agent who knows how to win bidding wars.
Advice for Sellers
You have the upper hand, but still pick a smart price. A fair number pulls many buyers and often beats your ask. Ask too much and you join the almost 24% of sellers who later cut their price and wait longer to close.
What Is the Cost of Living in Connecticut?
Cost of Living Snapshot
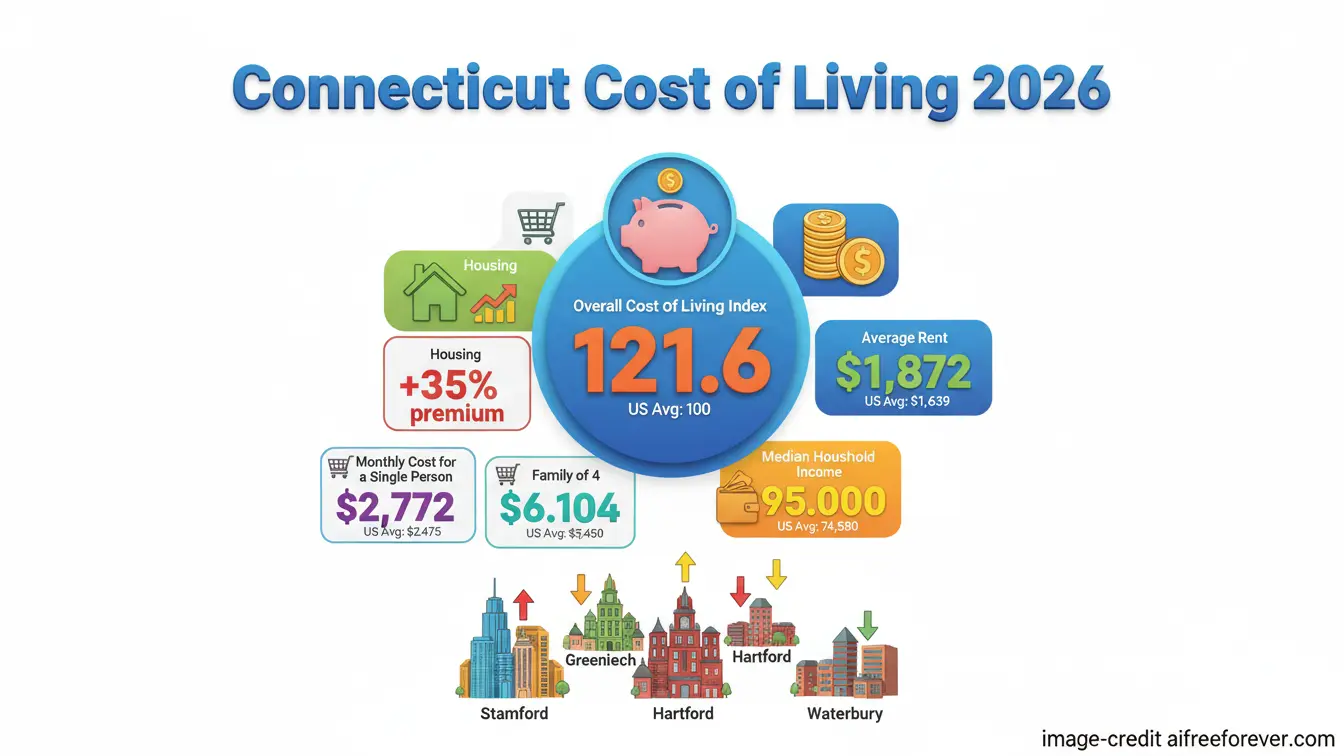
Connecticut costs more than most states. Salary.com reports the state is 12% above the U.S. average. Housing costs are 16% higher than average. Inside Investigator gives Connecticut a cost of living index of 121.6. This means daily expenses are about 22% higher than most states. Groceries, health care, and property taxes add to the total. Compare these extra costs to your income before choosing a town.
| Cost Category | Connecticut | National Average | Difference |
|---|---|---|---|
| Overall Cost of Living Index | 121.6 | 100 | +21.6% |
| Housing Costs | +35% above national | Baseline | Significant premium |
| Monthly Cost (Single Person) | $2,772 | $2,475 | +12% |
| Monthly Cost (Family of 4) | $6,104 | $5,450 | +12% |
| Average Annual Spending | $65,128 | $55,000 | +18% |
| Average Rent (All Types) | $1,872 | $1,639 | +14% |
| Median Household Income | $95,000 | $74,580 | +27% |
Cost of Living by Connecticut City
| City | Cost of Living vs State | Cost of Living vs National | Notes |
|---|---|---|---|
| Stamford | +14% | +29% | Most expensive in CT |
| Greenwich | +18% | +33% | Luxury market |
| Norwalk | +10% | +25% | NYC commuter hub |
| New Haven | -5% | +7% | College town, affordable |
| Hartford | -10% | +2% | Cheapest major CT city |
| Waterbury | -12% | 0% | Most affordable urban |
| Norwich | -8% | +4% | Affordable eastern CT |
What Are Historical Connecticut Home Price Trends?
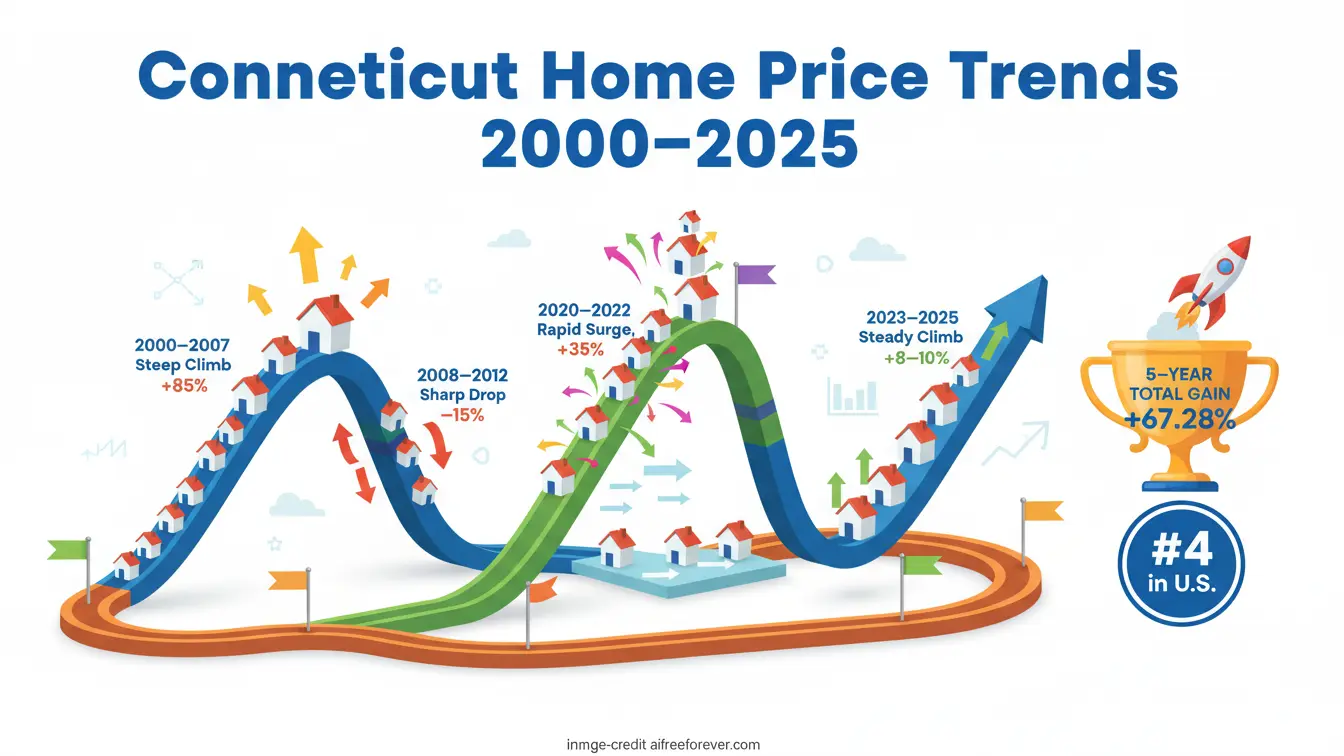
Connecticut home prices have gone up and down over time. From 2008 to 2018, prices stayed flat and lagged behind the national market. Since 2020, this has changed. Federal Reserve data shows the state’s House Price Index at a record high. Values have risen more than 67% in just five years.
| Time Period | Price Trend | Key Factors |
|---|---|---|
| 2000-2007 | +85% growth | Pre-recession boom |
| 2008-2012 | -15% decline | Financial crisis, foreclosures |
| 2013-2019 | +0.5% to +1.6% annually | Slow recovery, lagged national |
| 2020-2022 | +35% surge | Pandemic migration, low rates |
| 2023-2025 | +8% to +10% annually | Continued demand, low inventory |
| 5-Year Total (2020-2025) | +67.28% | #4 nationally for appreciation |
Will Connecticut Home Prices Drop?
Experts do not expect Connecticut home prices to drop much in 2026. According to Norada Real Estate, several factors keep prices stable:
Supply Constraints: Low inventory prevents big price drops. The state has only 2 months of supply. Construction is not meeting demand. There is no oversupply to push prices down.
Strong Employment: Connecticut has stable jobs in insurance, healthcare, finance, and education. This supports buyer demand.
Migration Patterns: People keep moving in from more expensive areas. This creates steady demand, especially in Hartford.
Limited New Construction: Zoning rules and development limits restrict new housing. This keeps pressure on existing home prices.
Price growth may slow from 8-10% to 3-4% per year through 2026. A big price drop is unlikely unless there is a major recession or a large increase in housing supply.
What Are the Best Areas to Buy in Connecticut?
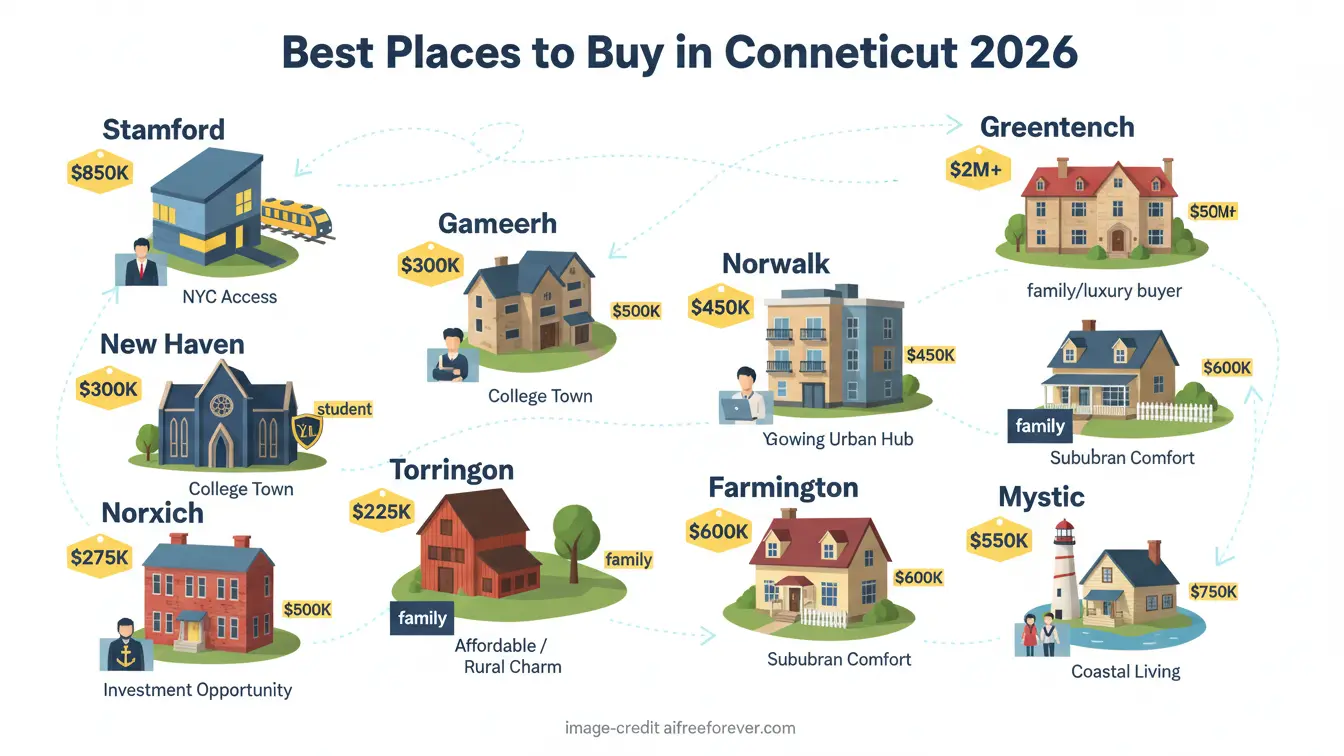
Different Connecticut regions offer distinct advantages for various buyer profiles:
| Region/City | Best For | Median Price | Key Advantages |
|---|---|---|---|
| Hartford | First-time buyers, investors | $270,000 | Affordable, hot market, job growth |
| New Haven | Young professionals, academics | $370,000 | Yale University, cultural amenities |
| Stamford | NYC commuters, professionals | $550,000+ | Metro-North access, corporate jobs |
| Waterbury | Budget-conscious buyers | $225,000 | Most affordable urban option |
| Torrington | Remote workers, families | $280,000 | Affordable, rural character |
| Norwich | Military families, retirees | $320,000 | Navy base, coastal access |
| Greenwich | Luxury buyers, executives | $2,000,000+ | Elite schools, NYC proximity |
| Middletown | Families, Wesleyan employees | $350,000 | College town, central location |
What Is the Connecticut Rental Market Like?
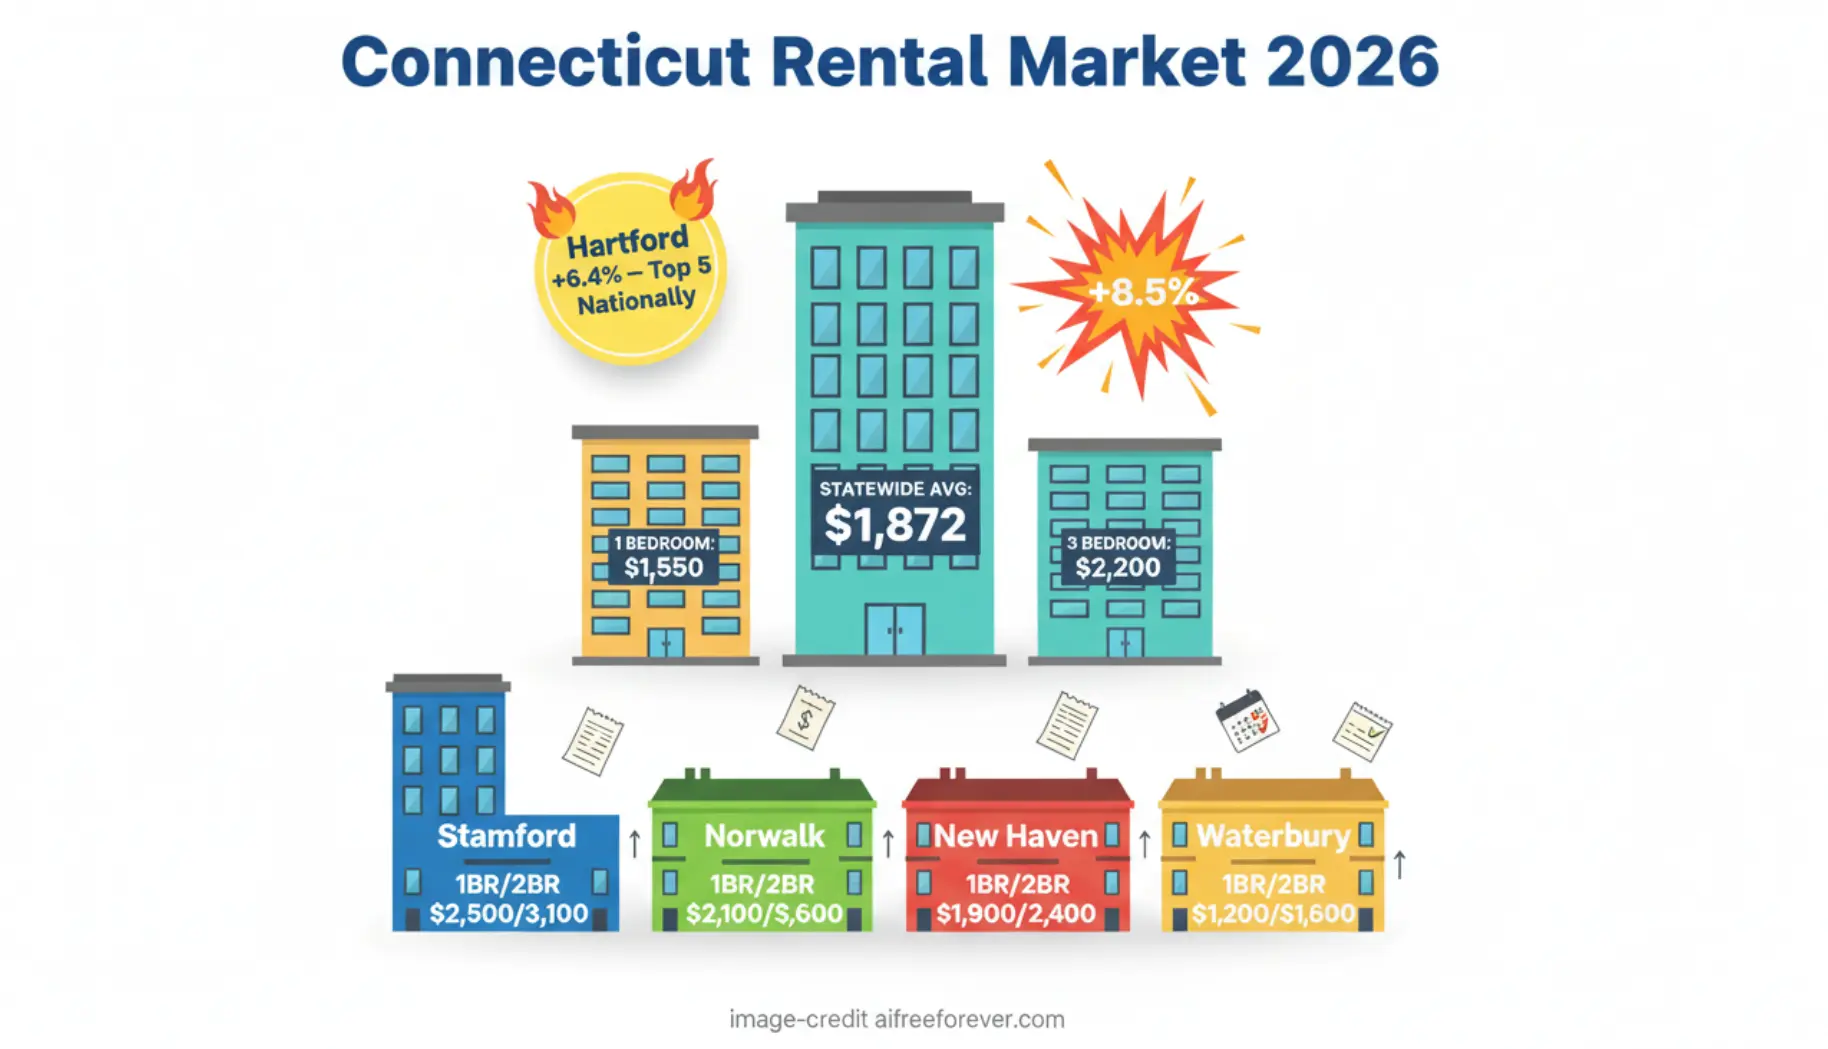
Connecticut’s rental market has the same pressures as the sales market. Supply is limited and costs are rising. According to ConsumerAffairs, the average rent is $1,872 per month. This is much higher than the national average of $1,639. Rental costs have risen about 8.5% year-over-year. Hartford saw one of the biggest increases in the country at 6.4%.
| Rental Metric | Connecticut | National Average | Difference |
|---|---|---|---|
| Average Rent (All Types) | $1,872 | $1,639 | +14% |
| 1-Bedroom Apartment | $1,500-$1,700 | $1,350 | +15-26% |
| 3-Bedroom Apartment | $3,400 | $2,200 | +55% |
| Year-over-Year Rent Increase | +8.5% | +3.2% | Higher growth |
| Hartford Rent Growth | +6.4% | N/A | #4 nationally |
Rent by Connecticut City
| City | Average Rent (1BR) | Average Rent (2BR) | Trend |
|---|---|---|---|
| Stamford | $2,400 | $3,200 | Rising steadily |
| Norwalk | $2,100 | $2,800 | Rising |
| New Haven | $1,650 | $2,100 | Moderate growth |
| Hartford | $1,450 | $1,788 | +6.4% YoY |
| Bridgeport | $1,500 | $1,900 | Steady |
| Waterbury | $1,200 | $1,500 | Most affordable |
Is Connecticut a Good Place to Invest in Real Estate?
Connecticut offers good opportunities for real estate investors. Markets show rising prices and strong rental demand. According to Steadily, rising property values, low inventory, and population trends create good conditions for long-term gains and rental income.
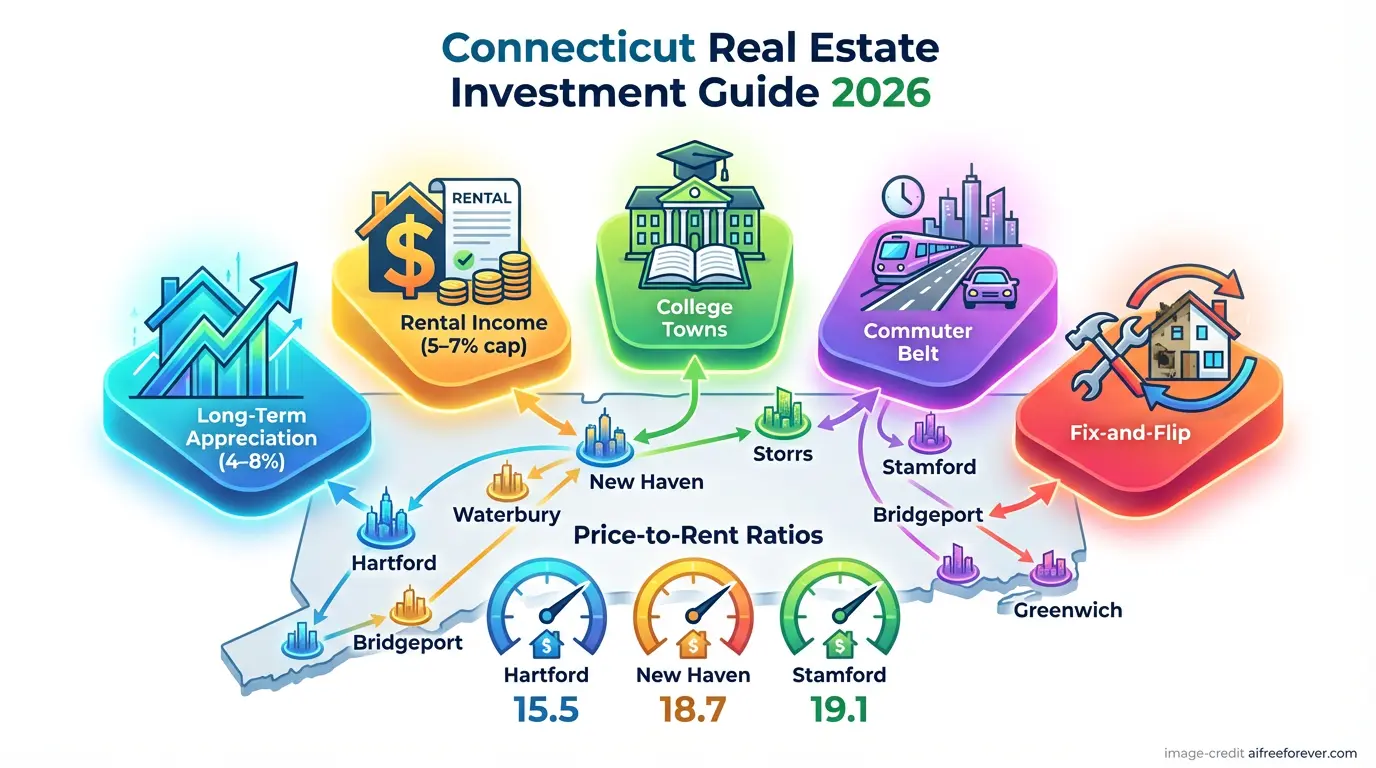
Investment Considerations by Market Type
| Investment Strategy | Best Markets | Expected Returns | Risk Level |
|---|---|---|---|
| Long-term Appreciation | Hartford, New Haven, Stamford | 4-8% annual appreciation | Low to Moderate |
| Rental Income (Traditional) | Hartford, New Haven, Waterbury | 5-7% cap rate | Moderate |
| College Town Rentals | New Haven (Yale), Storrs (UConn) | Consistent demand | Low |
| NYC Commuter Belt | Stamford, Norwalk, Greenwich | Premium rents, stable tenants | Low |
| Value-Add/Fix-and-Flip | Hartford, Bridgeport, Waterbury | Variable, market-dependent | Higher |
Key Investment Metrics by City
| City | Median Price | 5-Year Appreciation | Avg Rent | Price-to-Rent Ratio |
|---|---|---|---|---|
| Hartford | $270,000 | +65% | $1,450 | 15.5 |
| New Haven | $370,000 | +58% | $1,650 | 18.7 |
| Waterbury | $225,000 | +72% | $1,200 | 15.6 |
| Bridgeport | $285,000 | +55% | $1,500 | 15.8 |
| Stamford | $550,000 | +48% | $2,400 | 19.1 |
What Are Connecticut Property Taxes?
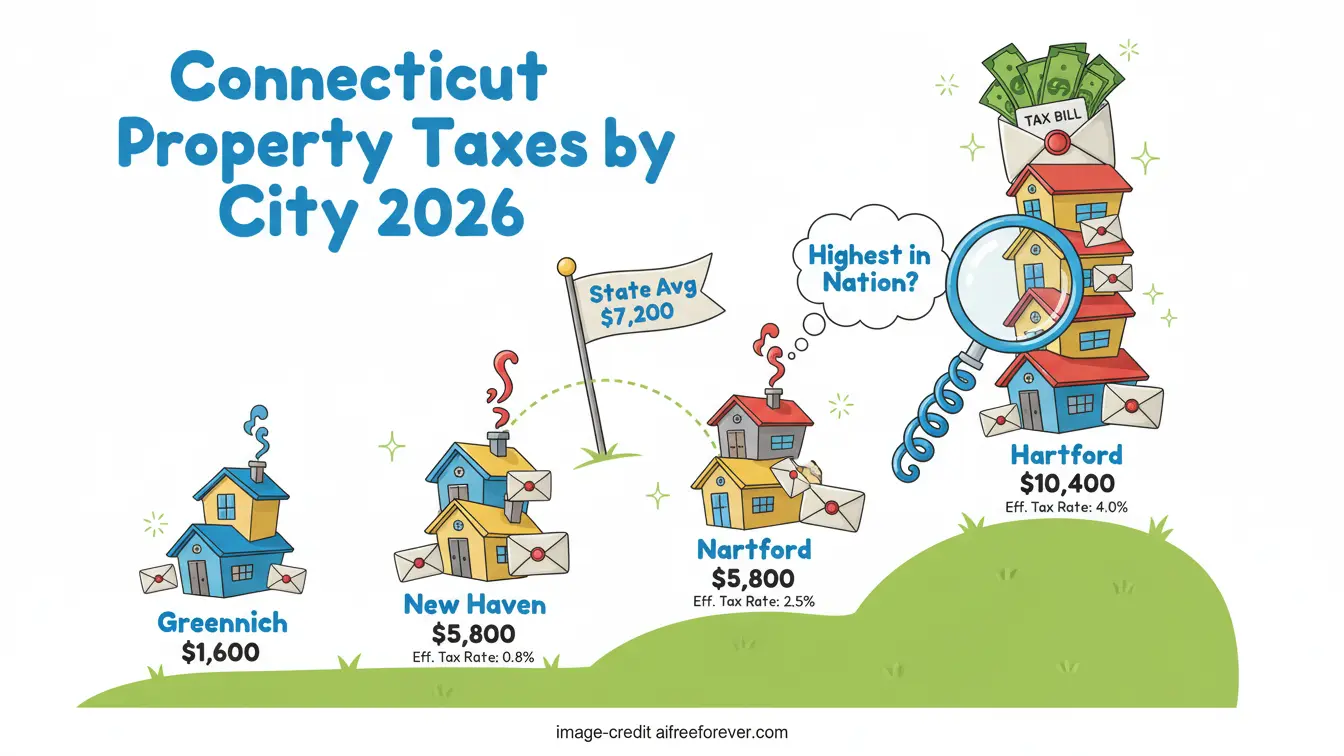
Property taxes are a big factor for Connecticut homeowners and investors. Connecticut has some of the highest property tax rates in the nation. This affects housing costs and investment returns. Rates vary widely by town. Mill rates range from under 20 to over 40 mills.
| City/Town | Mill Rate (per $1,000) | Effective Tax Rate | Tax on $400K Home |
|---|---|---|---|
| Hartford | 74.29 | ~2.6% | $10,400 |
| Bridgeport | 54.37 | ~1.9% | $7,600 |
| New Haven | 43.88 | ~1.5% | $6,100 |
| Stamford | 25.78 | ~0.9% | $3,600 |
| Greenwich | 11.59 | ~0.4% | $1,600 |
| Norwalk | 28.82 | ~1.0% | $4,000 |
| State Average | ~32.0 | ~1.8% | $7,200 |
What Are Connecticut Mortgage Rates and Financing Options?
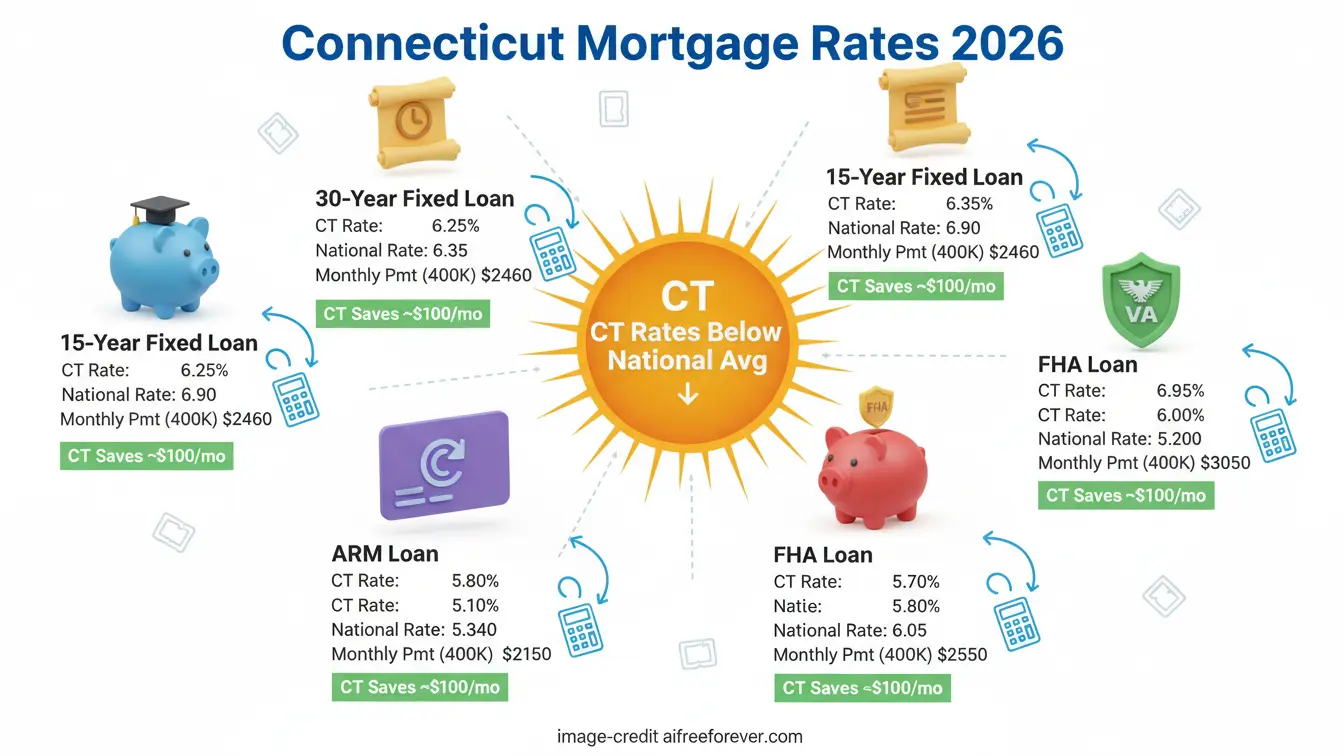
Connecticut homebuyers get mortgage rates slightly below the national average. The National Association of Realtors named Hartford a top housing hot spot. As of late 2025, Connecticut borrowers can get 30-year fixed rates around 6.5%. The national average is about 7.0%.
| Loan Type | Connecticut Rate | National Average | Monthly Payment ($400K) |
|---|---|---|---|
| 30-Year Fixed | 6.5% | 7.0% | $2,528 |
| 15-Year Fixed | 5.8% | 6.2% | $3,347 |
| 5/1 ARM | 6.0% | 6.5% | $2,398 |
| FHA Loan | 6.25% | 6.75% | $2,463 |
| VA Loan | 6.0% | 6.5% | $2,398 |
First-Time Homebuyer Programs in Connecticut
Connecticut has programs to help first-time buyers. The Connecticut Housing Finance Authority (CHFA) offers low-interest mortgages and down payment help. New state laws give first-time buyers tax deductions of $2,500-$5,000. This provides extra financial support for new buyers.
How Does Connecticut Compare to Neighboring States?
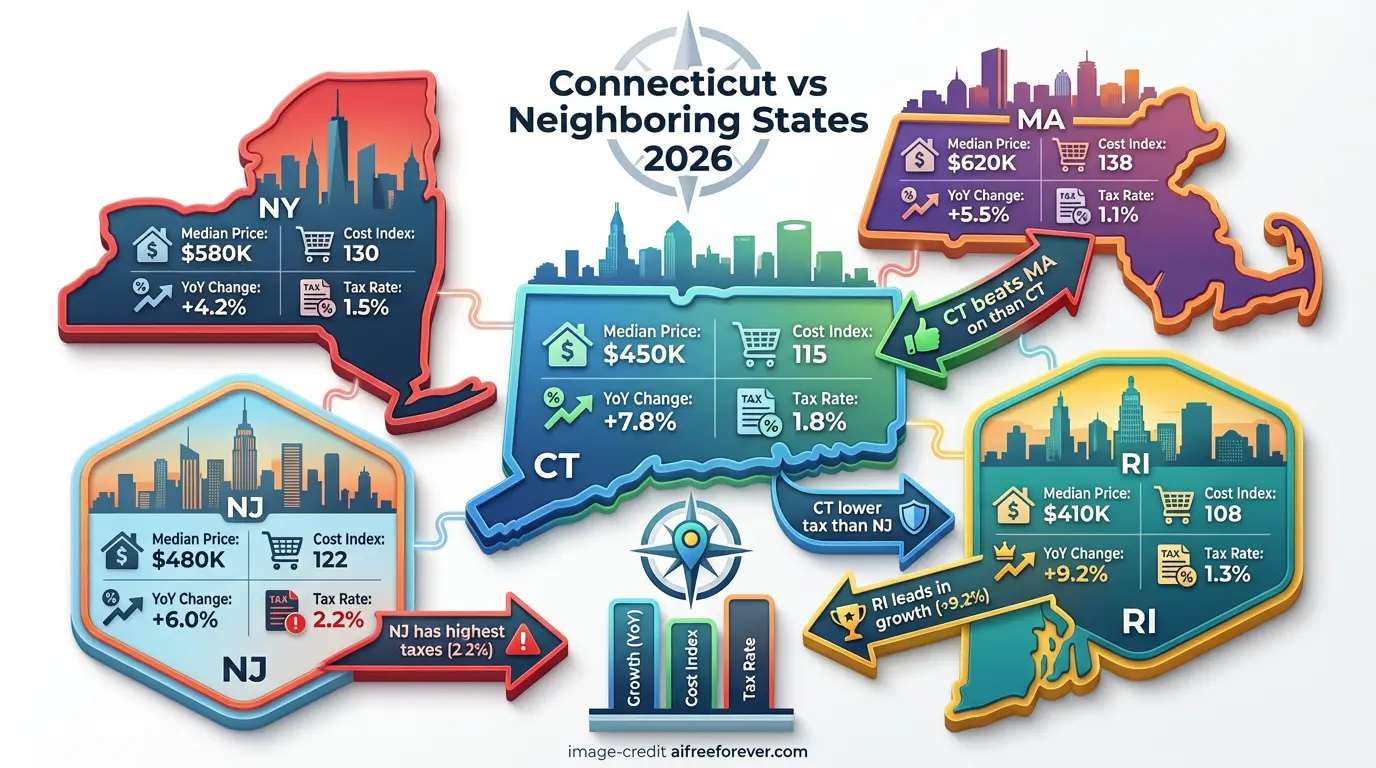
How Connecticut’s housing market compares to nearby states helps buyers and investors decide where to purchase in the Northeast.
| State | Median Home Price | YoY Price Change | Cost of Living Index | Property Tax Rate |
|---|---|---|---|---|
| Connecticut | $449,100 | +8.0% | 121.6 | 1.8% |
| Massachusetts | $615,000 | +5.5% | 135.0 | 1.1% |
| Rhode Island | $438,000 | +9.2% | 107.0 | 1.4% |
| New York | $420,000 | +3.5% | 139.1 | 1.7% |
| New Jersey | $510,000 | +6.8% | 115.2 | 2.2% |
Connecticut offers a middle ground between the higher costs of Massachusetts and the lower prices of Rhode Island. The state provides excellent access to both Boston and New York City job markets. Connecticut’s strong price growth beats most neighbors. This makes it attractive for those seeking lifestyle benefits and investment potential.
First-time buyers in Hartford, investors looking at Connecticut’s rising values, and sellers in this strong market all benefit from knowing current trends. This knowledge helps you make good decisions in Connecticut’s active real estate market.
Frequently Asked Questions About the Connecticut Housing Market
What is the median home price in Connecticut?
The median home price in Connecticut is approximately $449,100 as of October 2025, according to Redfin. This represents an 8.0% increase from the previous year. Prices vary significantly by region, from around $270,000 in Hartford to over $568,000 in Fairfield County.
What is the average house price in Connecticut?
The average house price in Connecticut ranges from approximately $377,247 (Zillow Home Value Index) to $424,144 (RealtyTrac) depending on the data source and calculation method. Single-family homes average around $446,900, while condos average $296,000.
Is now a good time to buy a house in Connecticut?
Connecticut remains a strong seller’s market with competitive conditions. While prices are elevated, the market shows no signs of declining. Buyers with strong financing and the ability to act quickly can find opportunities, particularly in more affordable markets like Hartford, Waterbury, and Norwich.
Why is Hartford the hottest housing market?
Hartford ranks as America’s hottest housing market due to its combination of affordable prices compared to other Northeast cities, extremely tight inventory (homes sell in 6 days on average), strong job market, and lower-than-average mortgage rates. Over 60% of Hartford homes sell above list price.
Will Connecticut home prices drop in 2026?
Most experts do not expect significant price drops in 2026. While price growth may moderate from 8-10% to 3-4% annually, persistent low inventory, stable employment, and continued demand from out-of-state buyers support price stability.
What is the Connecticut real estate market forecast for 2026?
Forecasts indicate continued price appreciation of 3-4.5% statewide through 2026, with Hartford and New Haven expected to lead growth. Inventory is expected to remain tight, maintaining seller-favorable conditions. Mortgage rates are projected to stabilize around 6%, potentially unlocking some additional inventory.
What are the most affordable places to buy in Connecticut?
The most affordable housing markets in Connecticut include Waterbury (median ~$225,000), Hartford (~$270,000), Torrington (~$280,000), and Windham County (~$285,000). These areas offer entry points for first-time buyers and investors seeking value.
How does Connecticut’s cost of living affect housing affordability?
Connecticut’s overall cost of living is approximately 21.6% above the national average, with housing costs about 35% higher than the national average. However, the state’s median household income of $95,000 (27% above national average) partially offsets these higher costs for employed residents.