KWL Chart
The KWL Chart is a project management reference tool covering kwl chart, kwl chart template, kwl chart printable, kwl chart for kids. Use the chart below to look up values instantly. Printable and downloadable versions are available on this page.
What Is a KWL Chart?
- KWL stands for Know, Want to Know, and Learned — a three-column graphic organiser developed by educational researcher Donna Ogle in 1986. Each column captures a different phase of the learning process.
- The K column (What I Know) is completed before instruction begins — students write everything they already know about a topic. This activates prior knowledge and connects new information to existing understanding.
- The W column (What I Want to Know) is also completed before instruction — students write questions they want to have answered. This creates purposeful reading and listening during instruction.
- The L column (What I Learned) is completed after instruction — students record what they have learned, check it against their questions, and note which questions were not answered (creating follow-up inquiry goals).
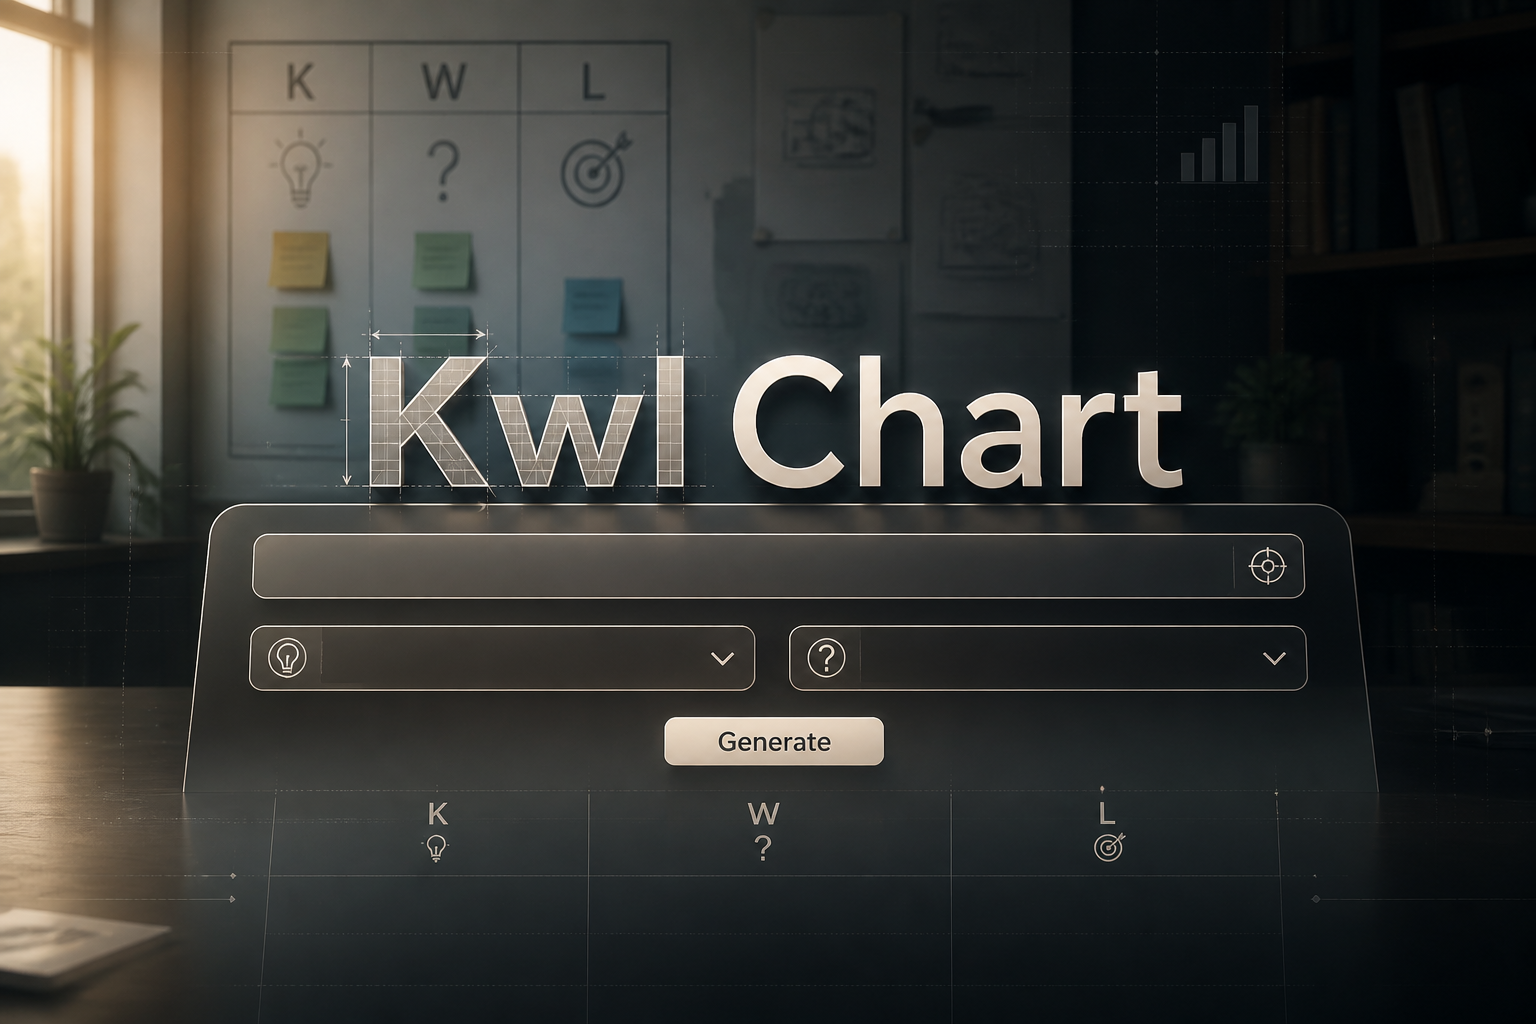
KWL Chart Template
| K — What I Know | W — What I Want to Know | L — What I Learned |
|---|---|---|
Source: KWL chart — Ogle D, 1986, K-W-L: A teaching model that develops active reading of expository text. The Reading Teacher.
KWL Chart Variations
| Variation Name | Added Column | Best Use |
|---|---|---|
| KWHL | H = How I Will Learn It (between W and L) | Research projects and independent inquiry — helps students plan their research strategy. |
| KWWL | Second W = Where I Can Find Information (between W and L) | Teaching information literacy and research skills — connects questions to sources. |
| KWLS | S = Still Want to Know (after L) | Deeper topics where one lesson raises further questions — extends inquiry beyond the lesson. |
| KWLQ | Q = Questions I Still Have (after L) | Post-lesson reflection — identifies gaps and promotes metacognition. |
| KWLA | A = Affect (how I feel about what I learned) | Social-emotional learning integration — connects content learning to personal response. |
KWL Chart — Completed Example
| K — What I Know | W — What I Want to Know | L — What I Learned |
|---|---|---|
|
Water goes up into clouds. Rain comes from clouds. The sun has something to do with it. Oceans have a lot of water. |
How does water get up into the sky? What makes it turn into rain? Where does all the water come from? Does the cycle ever stop? |
Evaporation — the sun heats water which turns to vapour and rises. Condensation — water vapour cools and forms clouds. Precipitation — water falls as rain, snow, sleet, or hail. Collection — water gathers in rivers, lakes, and oceans. The water cycle has been running continuously for billions of years. |
Source: Original illustrative example
KWL Chart Builder
Type into each column below to build your own KWL chart. Download it as a PDF, export it, or print it directly from your browser.
| K — What I Know | W — What I Want to Know | L — What I Learned |
|---|---|---|
Frequently Asked Questions
What does KWL stand for?
KWL stands for Know, Want to Know, and Learned — the three stages of this graphic organiser that guide learners through before, during, and after instruction.
Who invented the KWL chart?
The KWL chart was developed by Donna Ogle and published in 1986 in The Reading Teacher journal. It was designed to help students actively engage with expository (informational) text by activating prior knowledge and setting reading goals.
What age is the KWL chart appropriate for?
KWL charts are used effectively from approximately 2nd grade through university level. The format scales well — younger students use it with teacher guidance filling in the K and W columns together before reading while older students complete it independently.
What is the purpose of the K column?
The K column activates prior knowledge — bringing what students already know to the surface before new information is introduced. Research shows that new information is learned more effectively when connected to existing knowledge structures.
What if students write incorrect information in the K column?
Incorrect prior knowledge in the K column is valuable — it identifies misconceptions the lesson needs to address. Students can review their K column after the lesson to explicitly correct misconceptions they identified as "known."
How is a KWL chart different from regular note-taking?
Regular notes capture information after it is presented. The KWL chart is a pre-reading and pre-lesson strategy that frames the learning before it occurs — the W column questions create purposeful engagement rather than passive reception.
Can KWL charts be used in corporate training?
Yes — KWL charts are used in adult learning and professional development contexts. The same principles of activating prior knowledge and setting learning goals apply equally to adult learners in workplace training.
What is the L column used for after the lesson?
The L column serves two purposes — recording what was learned and checking it against the W column questions. Any W column questions left unanswered become the starting point for further research or follow-up inquiry.